Wednesday, November 18, 2015

Monthly Economic Commentary

Economic and market highlights

Economics

The US Federal Reserve left the federal funds rate unchanged in October but adopted a more hawkish tone in its press release, removing references to global financial and economic risks. The implication being that the chances of a December rate rise have increased. The target band remains 0 to 25 basis points. We forecast that the first Federal Reserve interest rate rise for the new tightening cycle will occur in December 2015, which is in line with market consensus.

The Chinese Caixin Flash Purchasing Managers Index (PMI) shows manufacturing activity continues to slow, although the reading was fractionally stronger than anticipated at 48.3, up from 47.2 the previous month. In the eurozone, PMI readings have been relatively robust for most of the year, with October’s registering at 52.3 while after some strong data in the US over the past year, things are looking a little more subdued with the PMI at 50.1 with purchasing managers surveyed citing the strong dollar and energy markets as headwinds.


Source: MWM Research, Caixin, ISM, Markit, November 2015

Deflation in Europe remains a concern with Germany's Harmonised Index of Consumer Prices (HICP) registering a 0.2% fall year-on-year, while import prices fell 3.1%. The Euro area HICP is -0.1% year-on-year with core inflation running at 0.9%.

The latest real GDP figures from China show a 6.9% growth year-on-year, with the announcement after the 5th Plenum reiterating the goal to double China's GDP between 2010 and 2020, implying an average growth rate of 6.5% per year over the next five years.

Canada entered a technical recession in the first half of the year but is expected to return to growth in the third quarter. Australia was sailing close to the wind with a 0.2% quarter-on-quarter growth rate in the June quarter, although we expect a rebound for the third and fourth quarters of 2015 with a pickup in manufacturing output and strong retail trade.

Bonds

The downward trajectory of US 10-year note yields over the last few months looks to be reversing with the latest statements from the Federal Reserve conspicuously removing warnings about global financial and economic risks. Fixed income markets are pricing in a greater chance of a December rate hike after what was perceived to be relatively more hawkish statements. Yields in the United Kingdom, also close to a new rate hike cycle, followed suit. In Europe, while 10-year rates moved, there was very little response at the short end, which remain relatively stable near or below zero due to quantitative easing.

Equities

Equities were broadly stronger in October as they began to shrug off the volatility of August and September. In local currency terms, the strongest developed markets were Germany and Japan, up 11.8 and 10.9% respectively. The US gained 8.1% while Australia lagged, adding only 4.2%. Emerging market equities underperformed developed markets with China rallying 9.1% while the MSCI Emerging Market Index recovered 5.3 percent, dragged down by Brazil, India and Russia.

The S&P500 has staged a dramatic recovery, rallying 11.6% from its September lows and now rests just 1.4% away from new highs.

Currencies

The Canadian dollar and Swiss franc gained 2.4% while the British pound was up a fraction less at 2.0%. The Australian dollar has strengthened 1.6% over the course of October. The Quantitative Easing currencies euro and yen lost 1.0 and 0.8% respectively.

__________________________________________

Clicking the Like button on various social media platforms, such as LinkedIn, Facebook, etc. does not constitute a testimonial for or endorsement of Redmount Capital Partners LLC or any Investment Advisor Representative. “Like” is not meant in the traditional sense. Posts must refrain from recommending investment advisory services or providing testimonials for our firm, since they are strictly prohibited. Please understand that we are required to delete such posts, since this is a regulatory requirement.

Monday, November 16, 2015

10 Charts That Show The U.S. Economy Is Still Underestimated

According to Macquarie analysts David Doyle and Brendan Livingstone there is more to U.S. economy than meets the eye.

"Despite a strong employment report for October, doubts persist in some corners about the resilience of the U.S. economic expansion," they wrote. "We remain confident in the outlook and believe strength should continue in equities with disproportionate exposure to the U.S. economy."

Macquarie is often correct in projecting global and macroeconomic trends. The firm has succeeded as the foremost infrastructure investor, globally, in part by seeing well the big picture.

To this end, Macquarie analysts compiled a list of 10 reasons why the American economy is better than you think.

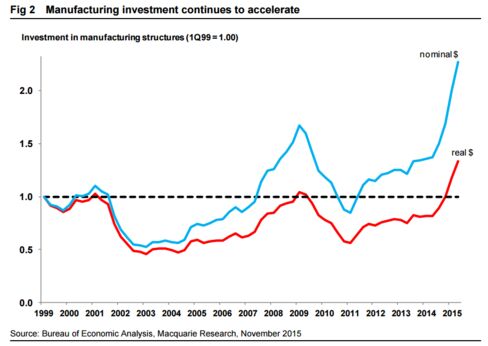
1. The U.S. manufacturing renaissance is alive

You wouldn't know it from the widely-cited ISM manufacturing purchasing managers' index, which suggests that the secondary sector is barely eking out any growth, but structures investment in this segment is booming:


"Nominal investment in this area is up over 60 percent year-over-year and has more than doubled since 2012," the analysts wrote. "Manufacturers are increasingly building new plants and making improvements to existing plants.

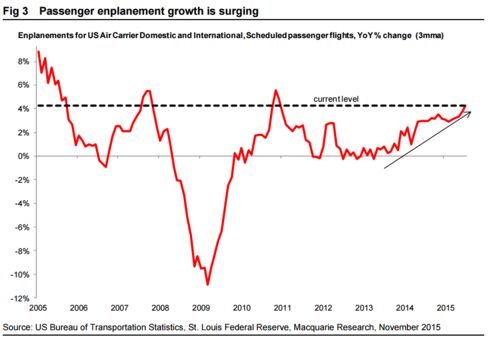
2. Air travel is taking off

Cheap fuel, the lofty U.S. dollar, and an improving economy have served as tailwinds for miles flown domestically and abroad to surge:


"Enplanement growth is accelerating and has reached its fastest pace of growth in five years," wrote Doyle and Livingstone.

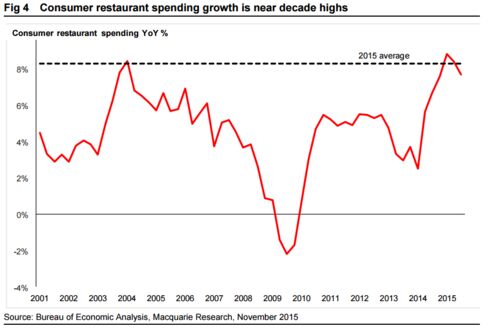
3. People are going to restaurants

Another clear beneficiary of the plunge in gas prices: restaurateurs. Nine readings into 2015, the average annual growth is running at roughly its peak rate during the previous cycle:


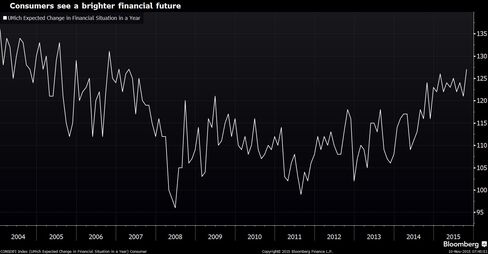
4. Consumers are increasingly optimistic

A sub-component of the University of Michigan consumer sentiment survey shows that the net percentage of respondents who expect their financial situation to be better in a year has hit its highest level since 2007:


This bodes well for future spending growth, according to the analysts.

5. Workforce entrants come with caps and gowns

"Over the past two years, a net 3.5 million workers with bachelor degrees or higher have entered the labor force, while a net 1.1 million workers with less than this level of education have departed from it," wrote Doyle and Livingstone.


The negative impact that the slowing in labor force additions has on gross domestic product growth may be somewhat offset by higher productivity from these better-educated employees. An environment in which well-educated workers drive labor force growth also augurs well for a reduction in income inequality, as those offering jobs that require fewer prerequisites find that the pool of available workers has shrunk, at least in relative terms.

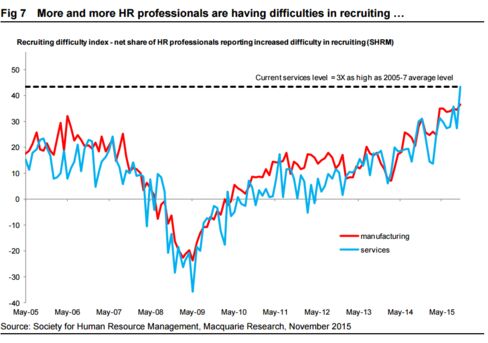
6. The labor force is tight ...

A survey of Human Resource executives shows companies are having trouble finding new prospects:


Slack in the services sector, by far the dominant portion of the American economy, is particularly scarce, compared to the previous cycle.

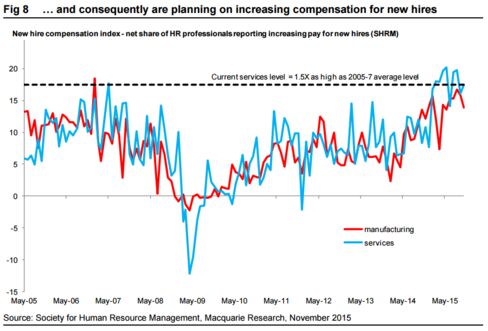
7. So new hires are getting pay raises

Unsurprisingly, the dearth of good talent has resulted in new hires getting pay raises "well above the average from 2005 to 2007, yet another sign of a tight labor market," the analysts wrote.


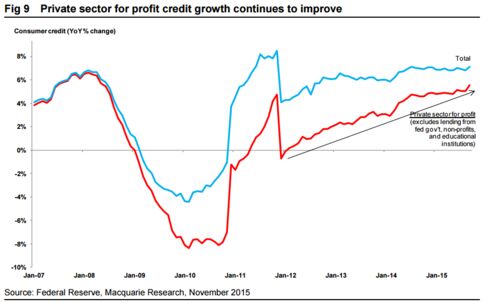
8. Private sector credit growth pushing higher

"While headline consumer credit has been stable at 7 percent year-over-year, this masks firming fundamentals," wrote Doyle and Livingstone. "Credit growth from the federal government and not for profits has been decelerating, while credit growth from private sector for profit lenders has been rising steadily."


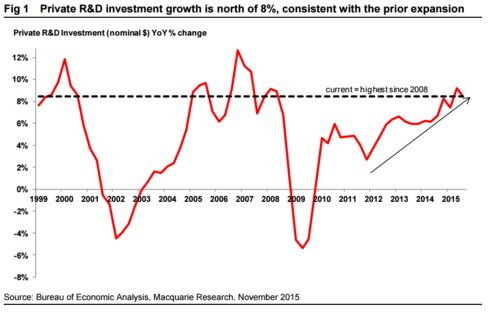
9. Robust investment in innovation

The growth in research and development expenditures has eclipsed its pre-recession pace, moving steadily higher since 2012:


10. Producer price inflation is hotter under the hood

While market-based measures of inflation compensation suggest that fears about deflation can remain elevated, producer prices tell a different story. Excluding food and energy, the core producer price index is up a healthy 2.1 percent, year-over-year, Macquarie observes:


Source: Macquarie, Bloomberg

Note: Information contained herein has been obtained from sources believed to be reliable, but Redmount accepts no responsibility or liability (including for indirect, consequential or incidental damages) for any error, omission or inaccuracy of such information. The projections shown are provided for informational purposes only and should not be construed as investment advice or providing any assurance or guarantee as to returns that may be realized in the future from your private equity commitments. Projections and expected returns are subject to high levels of uncertainty regarding future economic and market factors that may affect future performance.Accordingly, such projections/expectations should be viewed as only one possibility out of a broad range of possible outcomes.
__________________________________________

Clicking the Like button on various social media platforms, such as LinkedIn, Facebook, etc. does not constitute a testimonial for or endorsement of Redmount Capital Partners LLC or any Investment Advisor Representative. “Like” is not meant in the traditional sense. Posts must refrain from recommending investment advisory services or providing testimonials for our firm, since they are strictly prohibited. Please understand that we are required to delete such posts, since this is a regulatory requirement.
Monday, November 9, 2015

3Q 2015 Private Equity Environment

Global equity markets fell sharply in the third quarter, driven by concerns over slowing global growth, particularly in China, and uncertainty over the U.S. Federal Reserve’s monetary policy. The MSCI World Index declined by 8.3% in the third quarter, the index’s worst quarterly performance since the third quarter of 2011. Nearly every single-country equity index posted a loss, led by the Shanghai Composite, which declined by 27.9% during the quarter despite a raft of measures undertaken by the Chinese government to stem the sell-off. Other emerging markets and commodities also declined significantly, weighted down by fears of contagion and the knock-on effects of a slowdown in China. The S&P GSCI index, which measures a basket of 24 different commodities, declined by 19.3% in the third quarter, which brought the index to its lowest level since 1999.

Highlights
  • Equity market volatility adversely impacted IPO issuance during the quarter. Global IPO issuance in 3Q15 totaled $13.6 billion, a 76.8% decline from 3Q14 and the lowest quarterly total since 1Q12. 
  • Global buyout investment activity has increased only moderately over the past few years, and 2015 is on track to continue the trend. YTD 3Q15 buyout transaction activity totaled $289.8 billion, an increase of 2.7% over YTD 3Q14
  • PE firms worldwide raised $58.1 billion in 3Q15, a 43% decrease from the prior quarter and a 31% decrease from 3Q14. The decrease was driven by buyout- and U.S.-focused fundraising activity
Private Equity Investment Activity
U.S. Buyout Investment Activity


U.S. buyout investment activity totaled $55.8 billion during the third quarter of 2015, down approximately 14% from both the prior quarter and the same period in 2014, according to data from
Thomson Reuters. This brought total U.S. buyout investment activity for the first three quarters
of the year to $190 billion, a decline of 5% from the same period in 2014. The year-over-year decline in investment activity is reflective of the increasing wariness of many general partners in the face of rising valuations in a competitive market environment. Many general partners are setting a high bar for new investments, which is restraining overall investment activity. The average purchase-price-to-EBITDA multiple (across all transaction sizes) for new buyout
investments was 10.3x for the first three quarters of 2015, up from 9.7x for all of 2014, according to S&P LCD. Although average purchase-price multiples are increasing, general partners continue to be disciplined and are structuring their transactions conservatively: the average equity contribution
rate for a buyout transaction completed so far this year is 40.8%, and the average debt-to-EBITDA multiple is 5.6x; the corresponding rate and multiple for all of 2014 are 37.0%
and 5.7x, respectively (see table 3).

Non-investment-grade debt markets were not immune to financial market volatility during the third quarter. The BofA Merrill Lynch High Yield Master II index generated a –4.9% return in the third
quarter, which drove an increase in its option-adjusted spread to 662 basis points over U.S. Treasuries—its highest level since June 2012. U.S. leveraged loan issuance totaled $115 billion in the third quarter, a decline of 14.8% from the year-ago period. Year-to-date 2015, U.S. leveraged loan issuance totaled $341 billion, a 24.3% decline from the same period in 2014. The decline in leveraged
loan issuance was due to a number of factors, including the slowdown in buyout investment activity in recent quarters, a shift toward more-conservative financing structures (which occurred as a result of the banking industry’s new leveraged lending guidelines), and the recent increase in credit spreads (which is tempering issuer appetites).
The largest announced U.S.-based buyout transaction during the quarter was the $12.6 billion acquisition of Oncor, a Texas-based electric transmission company, by a syndicate of investors including the Hunt Group, Avenue Capital, Centerbridge Capital, and GSO Partners. If completed, this would also be the largest buyout transaction of the year thus far. The investor group is acquiring Oncor from Energy Future Holdings, which is currently in bankruptcy court, eight years after its record-setting buyout led by KKR and TPG. Other notable buyout transactions announced during the
quarter include the $8.0 billion carve-out of Veritas from Symantec, led by Carlyle Group, and the $6.5 billion take-private of insurance software provider Solera, led by Vista Equity Partners.

Fundraising Market

Private equity firms worldwide raised $58.1 billion in the third quarter of 2015, a 43% decrease from the prior quarter and a 31% decrease from the $84.7 billion raised in the year-ago quarter, according to Thomson Reuters. The third quarter figure brought year-to-date worldwide private equity
fundraising to $246 billion, which is just slightly ahead of the $245 billion raised over the same period in 2014.

The quarter-over-quarter decrease in worldwide private equity fundraising was primarily driven by U.S.-focused funds, which raised $31.5 billion in the third quarter—a 58% decrease
from the prior quarter and a 44% decrease from the year-ago quarter. Significant decreases relative to the second quarter of 2015 occurred in each major strategy. After strong starts to the year for both U.S. buyout and venture capital fundraising, the strategies raised just $13.6 billion and $4.6
billion, respectively, which rank 33% and 24% below the average quarterly levels experienced for their strategies over the past five years. Notable U.S.-focused fund closings during the third quarter include American Industrial Partners VI, which raised $1.8 billion, and Insight Venture Partners IX, which held its final closing at $3.3 billion.

Europe-focused funds raised $19.9 billion during the third quarter, flat from the prior quarter but up 8% from the amount raised in the year-ago quarter. The primary driver of the region’s year-over-year increase was the growth in venture capital fundraising: the $3.0 billion raised during the third quarter was the highest quarterly total since the fourth quarter of 2008. Asia-Pacific-focused funds raised $5.9 billion during the quarter, an 83% increase from the measured second quarter; however, the year-to-date total of $14.7 billion raised in 2015 represents less than 50% of the corresponding 2014 total. The largest Asia-Pacific-focused fundraising round held during the third quarter was that of Chinese venture capital fund Shunwei China Internet Fund III, which closed on $1.0 billion. 

During the third quarter, buyout funds raised $30.3 billion, a 43% decrease from the prior quarter (or a decrease of 15% when excluding the $17.0 billion close of Blackstone Capital Partners VII in the second quarter). Fundraising within the segment was broad-based: nine buyout-focused partnerships raised $1.0 billion or greater, highlighted by EQT VII, which closed on $7.4 billion, the largest amount raised during the quarter. Fundraising for venture capital–focused funds remained relatively flat during the third quarter: the $9.9 billion raised worldwide represented a 5% decrease
from the prior quarter and a 5% increase from the year-ago quarter. The aforementioned decline in U.S. venture capital fundraising, combined with a greater than 70% increase in quarter-over-quarter fundraising in every other major global region, resulted in just 46% of the worldwide venture capital
fundraising total being raised in the United States—the lowest percentage raised by the region since the fourth quarter
of 2011.

Energy-focused fundraising experienced a significant slowdown during the third quarter, following three consecutive quarters of record-setting activity. Energy funds raised $5.5 billion, which represents a 27% decrease from the strategy’s 5-year quarterly average of $7.5 billion. Despite the decrease in overall volume, notable firms in the energy private equity space continued to accumulate significant amounts of capital following the downturn in oil and natural gas prices: Ridgewood Energy Oil & Gas III ($1.6 billion), Apollo Natural Resources Partners II ($1.3 billion), and ArcLight Energy Partners VI ($0.9 billion) accounted for 70% of the quarterly energy fundraising total. Fundraising for other private equity strategies (i.e., subordinated debt, infrastructure, and special
situations) represented 21% of the total amount raised during the third quarter.

Source: Pathway Capital, Bloomberg, S&P LCD. 

Note: Information contained herein has been obtained from sources believed to be reliable, but Redmount accepts no responsibility or liability (including for indirect, consequential or incidental damages) for any error, omission or inaccuracy of such information. The projections shown are provided for informational purposes only and should not be construed as investment advice or providing any assurance or guarantee as to returns that may be realized in the future from your private equity commitments. Projections and expected returns are subject to high levels of uncertainty regarding future economic and market factors that may affect future performance.Accordingly, such projections/expectations should be viewed as only one possibility out of a broad range of possible outcomes.


__________________________________________

Clicking the Like button on various social media platforms, such as LinkedIn, Facebook, etc. does not constitute a testimonial for or endorsement of Redmount Capital Partners LLC or any Investment Advisor Representative. “Like” is not meant in the traditional sense. Posts must refrain from recommending investment advisory services or providing testimonials for our firm, since they are strictly prohibited. Please understand that we are required to delete such posts, since this is a regulatory requirement.
Tuesday, November 3, 2015

The Opportunity of Stimulated International Small Caps

Additional bond-buying moves by the European Central Bank could extend the rally in the asset class.

Quantitative easing (QE) may be approaching an end in the United States, but the party is just starting in the eurozone. With the European Central Bank’s (ECB) pledge last week to not only continue but also possibly extend, if necessary, its bond-buying program beyond September 16, 2016, market sentiment is improving, and that is supporting the performance of small-cap stocks in the eurozone.

Based on the experience of Japan and the United states, small-cap stocks tend to outperform large caps in the months following the announcements of quantitative easing. The question we posited at the time was, “Would we see a similar response in Europe?” As Chart 1 suggests, if the trend line continues, the eurozone’s small-cap stocks may be well on their way to outperformance.

Chart 1. U.S. and Japanese Small Caps Outperformed after QE—Is Europe Next?
Performance of small-cap stocks relative to large caps in the months following the announcement of quantitative easing, post-2008


Source: Bloomberg.

Moreover, we believe that non-U.S. stocks in general are poised for recovery. The MSCI ACWI ex-US Index (on a price-return basis) peaked on October 7, 2007, and, as Chart 2 indicates, has yet to recover that position, unlike the S&P 500 Index, which benefited from the U.S. Federal Reserve’s quantitative easing following the financial crisis of 2008–09. With quantitative easing just starting in the eurozone, investors should consider the possibility of a similar recovery, if not further gains, in non-U.S. stocks.

Chart 2. Lagging Recovery in Non-U.S. Stocks May Leave Room for Additional Upside
Non-U.S. stock returns versus U.S. stock returns (price return only, as of 10/15/15)


Source: Bloomberg

In terms of small-cap stocks, there is an apparent correlation between small-cap performance and QE, at least in the developed markets, which can be explained by a number of factors peculiar to the small-cap asset class. First, small caps tend to be concentrated in growth-oriented sectors, such as information technology and consumer discretionary, where valuations are pushed up by investors seeking returns in the early stages of recovery. Second, small-cap valuations are supported by the potential for acquisition as larger firms seeking growth take advantage of low borrowing rates during a period of QE to acquire targets. Third, divergent monetary policies in the United States and Europe have weakened the euro versus the U.S. dollar, benefiting eurozone exporters and boosting local economic growth and, thus, small caps, which benefit from the stimulation of local domestic demand.

Because international small-cap stocks are less likely to rise and fall with their U.S. counterparts (and with the broader U.S. market as well), the asset class better lends itself to active management strategies, while it complicates the outlook for more passive investment strategies.

History seldom repeats itself, but often there are discernible patterns. We have seen the positive performance of U.S. and Japanese small caps following QE in those respective regions, and we believe that QE could have similar benefits in the eurozone and in other regions where QE strategies are applied. And so far, the data from the eurozone seem to support our case.

____________________________________________
Clicking the Like button on various social media platforms, such as LinkedIn, Facebook, etc. does not constitute a testimonial for or endorsement of Redmount Capital Partners LLC or any Investment Advisor Representative. “Like” is not meant in the traditional sense. Posts must refrain from recommending investment advisory services or providing testimonials for our firm, since they are strictly prohibited. Please understand that we are required to delete such posts, since this is a regulatory requirement.
Monday, October 12, 2015

Rising Rates. Look closer for opportunities.

After more than six years, the Fed is finally poised to end its zero-interest-rate policy and embark on its first rate hiking cycle in nearly a decade.

We believe this is no ordinary rate cycle – and that the Fed is simply “normalizing” rates from their low levels since the financial crisis. The Fed has also signaled that rate increases will be gradual, which should keep interest rates below historic averages for some time. As a result, we expect rates to rise slowly, remaining below historical averages for some time.

Moreover, we believe that rising rates will be along the strengthening, growing economy – and for well-prepared investors, rising rates can signal opportunity.

A thoughtfully allocated, diversified portfolio can help reduce the impact of rising rates as well as capture growth potential.

1st: Seek a better balance of risk and return

Seek a better balance of risk and return by focusing on credit exposure while reducing interest rate exposure. Corporate bonds typically provide additional yield over Treasuries. Shortening the duration of your bond portfolio can help to reduce your interest rate risk. Combining these actions can be an effective way to navigate a rising rate environment.

Barclays U.S. 1-3 Year Credit Bond Index performance (June 2004 – June 2006)


Source: Barclays as of 8/12/15. Index returns are for illustrative purposes only. Index performance returns do not reflect any management fees, transaction costs or expenses. Indexes are unmanaged and one cannot invest directly in an index.


_____________________________________________
Clicking the Like button on various social media platforms, such as LinkedIn, Facebook, etc. does not constitute a testimonial for or endorsement of Redmount Capital Partners LLC or any Investment Advisor Representative. “Like” is not meant in the traditional sense. Posts must refrain from recommending investment advisory services or providing testimonials for our firm, since they are strictly prohibited. Please understand that we are required to delete such posts, since this is a regulatory requirement.

Monday, October 5, 2015

Is there a recession on the horizon?

The last few days have reminded everyone how quickly markets can turn. In the space of barely a week, the VIX Index, a measure of market volatility, spiked from 13, suggesting extreme complacency, to over 50, evidencing total panic.

Are the fears overblown? Many think so. Some see more to come. What is the reality?

1. The United States is a relatively closed economy

Most U.S. economic activity, nearly 70% of it, comes from domestic consumption. While the country isn’t immune to external shocks, there needs to be a transmission mechanism, such as a spike in oil prices, to impact the domestic economy.

Though a strong dollar and weakness in China have had a negative impact on U.S. corporate earnings, neither has had a material impact on overall U.S. growth. In fact, some of the disruptions from overseas come with silver linings for U.S. consumption and growth: lower rates and cheaper oil.

2. Higher rates are unlikely to derail the recovery

Rates are falling, supporting the housing market. Given low inflation and falling inflation expectations, the Federal Reserve (Fed) is likely, at most, to execute a single rate hike this year. This is in contrast to how most recessions start, with the Fed moving too aggressively and rates rising too rapidly.

3. Cheaper oil is a positive for U.S. consumers

Though the U.S. now has a large domestic energy industry that is feeling the pain from lower oil and the U.S. consumer certainly faces many headwinds, cheaper gasoline should support U.S. consumption.

4. There is little statistical evidence that the U.S. economy is slowing

Prior to the last recession there were several red flags signifying a recession ahead. According to Bloomberg data, leading indicators had been negative for nearly two years, new manufacturing orders slipped into contraction territory in January 2008 and the Chicago Fed National Activity Index (CFNAI), my preferred metric for forecasting near-term activity, had been consistently in negative territory for most of 2007 and all of 2008.

This time around, lower rates and cheaper gasoline help explain why the numbers look very different, as Bloomberg data show. The CFNAI actually hit a 7-month high in July, leading indicators are up roughly 4 percent year-over-year, and despite the slowdown in China, the new orders component of the U.S. ISM survey is 56.5, consistent with solid if uninspiring growth.

There are two caveats. 

First, in today’s slow growth world, it won’t take much to knock the U.S. economy off of its trajectory. As we’ve seen in recent years, a cold winter is enough to cause at least a temporary contraction.

Second, it’s possible to have a bear market without a recession, though I don’t expect this to occur. But if international market volatility becomes severe enough, it could drag down U.S. stocks, even as the U.S. economy continues to grow.

_____________________________________________
Clicking the Like button on various social media platforms, such as LinkedIn, Facebook, etc. does not constitute a testimonial for or endorsement of Redmount Capital Partners LLC or any Investment Advisor Representative. “Like” is not meant in the traditional sense. Posts must refrain from recommending investment advisory services or providing testimonials for our firm, since they are strictly prohibited. Please understand that we are required to delete such posts, since this is a regulatory requirement.
Tuesday, September 22, 2015

5 Things Bill Gates and other mega entrepreneurs have in common

Bill Gates' net worth is around $80 billion. He owns the $12.6 billion ownership of Microsoft. He also owns a $4.5 billion ownership in Canadian National Railroads, a $3 billion ownership in Republic Services, and a $2.8 billion ownership in in Ecolab. His diversified investments, through Cascade Investments, amount to $37.6 billion. 

As such, Microsoft, the company he started and associated with the most, stands for only 16% of his family wealth. 

Bill Gates is a mega entrepreneur. 

What sets very successful entrepreneurs, like Bill Bill Gates, apart from the rest? What turns them into mega entrepreneurs running a myriad of companies, overseeing immense and complex web of capital, and forging multigenerational wealth and legacy?

Here are some interesting statistics on mega entrepreneurs:
  • One third of FORTUNE 500 companies are owned or controlled by mega entrepreneurs or their families
  • 67% of NYSE companies are owned or controlled by mega entrepreneurs or their families
On the other hand:
  • About 30% of entrepreneur started and led business survive to the second generation
  • Only 12% make it to the third generation
  • Only 3% make it to the fourth generation
Many wonder what has become of the Rockefellers' ownership and clout over Exxon, Mobil, Chevron, Amoco, Standard Oil of Ohio, Atlantic Richfield, etc. We wonder as well, but its not there...anymore.

All entrepreneurs face the same challenges as they grow their start-ups in to successful companies:
  1. Raising capital without losing control 
  2. Recruiting and retaining top talent 
  3. Business continuation and succession 
  4. Converting profits and value to wealth
How mega entrepreneurs deal and keep dealing with the above challenges makes the difference. 

So, what sets mega entrepreneurs, apart from the rest? 

  1. Mega entrepreneurs have the "big-picture focus".
  2. They take risk and leverage financial and human capital to grow their enterprise.
  3. They rely on their entrepreneur's offices to manage finances, support M&A deals, raise or repay personal capital, execute financial reorganizations or restructure debt. Employees of their core companies are not involved in these processes. 
  4. Liquidity and cash management is given a high priority, managing cash efficiently and having it ready for difficult times and when great opportunities arise.
  5. Risk management is paramount.
Below are some examples of mega entrepreneurs and their strategies. 

Click the graphic to enlarge
Susanne Klatten: Dynasty Company as the Backbone of Dynasty Fortune. Wealth created though growth of a single company, BMW. Company is still a key asset of the family and its business identity. Other key assets are acquired and sold in line with “Dynasty Company” strategy

Click the graphic to enlarge
Leonardo Del Vecchio: Multi-Generational Family Company Leading to a Dynasty Fortune. Wealth creation through growth of a single company, Luxottica. Company is the identity of business family. Strategically and selectively diversifying dynasty fortune.

Click the graphic to enlarge
Bill Gates: Company Value Leading to a Multi-Company Family Fortune. Wealth creation though a growth of a single company, Microsoft. Diversification of holdings and assets. Establishment of strategic wealth thought.

Click the graphic to enlarge
Wang Jianlin: Diversified Entrepreneurships Leading to Family Fortune. Wealth creation through network of holdings growth. Increased concentration of holdings in key companies and assets. Strategic diversification across asset classes and geographies.

“The difference between a business family and a business dynasty is the strategy. Everything must be in line with strategy. Selling assets, exiting ventures… followed by reinvestment of capital – in everything strategy sets the rules.” - Baron Albert Frère, Founder and Chairman of Groupe Bruxelles Lambert, one of the largest family enterprises.

Statistics & Graphics: Courtesy of Financial Strategist Board.


_____________________________________________
Clicking the Like button on various social media platforms, such as LinkedIn, Facebook, etc. does not constitute a testimonial for or endorsement of Redmount Capital Partners LLC or any Investment Advisor Representative. “Like” is not meant in the traditional sense. Posts must refrain from recommending investment advisory services or providing testimonials for our firm, since they are strictly prohibited. Please understand that we are required to delete such posts, since this is a regulatory requirement.
Friday, September 18, 2015

Redmount’s brief opinion on the Federal Reserve’s (Fed) decision to not move on rates

We think it probably won’t do anything good for markets
  • Attention will now simply shift to “will they/won’t they” for their October meeting.
  • There had been expectations for a “one and done” increase of 0.25%, but that became more and more unlikely given the market tabulations.
  • That said, an increase to the fed funds rate of 0.25% would be a rational response to the probably very slow profile of rate rises over the next 12 to 18 months.
  • Initial rate rises have typically been followed by continued equity market performance on average while the final ones usually brought economic contraction and earnings recessions resulting in stock market losses.
  • And that’s what we’re concerned about, earnings trends. As history suggests, “don’t be afraid of the first interest rate rise, be afraid of the last one
  •  In general, we remain concerned with market volatilities.

Wednesday, September 9, 2015

4 Investment Risks Warren Buffett Says You Should Not Take

What does risk mean to you...and Warren Buffett? 

If you ask the average person, they’re likely to say the probability of losing money. If you ask most financial professionals, they’ll probably equate risk with volatility of returns. (While these may sound similar, they’re not exactly the same thing.) For example.

Let’s say investment A loses 3% one year and gains 2% the next and investment B gains 5% one year and 20% the next. Most people would call investment A riskier since it lost money while financial professionals would say investment B is riskier because the returns were more variable.) But if you ask Warren Buffett, the second richest American and widely considered the greatest investor alive today, he would say they're both wrong.

In his 2014 annual letter to shareholders, Buffett wrote:
“Volatility is far from synonymous with risk… If the investor…fears price volatility, erroneously viewing it as a measure of risk, he may, ironically, end up doing some very risky things.”
Instead of volatility, Buffett measures risk as the loss of purchasing power or basically how much you can actually buy with that money, which is the whole point of actually having it.

______________________________________
What is your risk tolerance?
How much risk is there in your portfolio? 
Start below or Learn more here >>


So what are those “very risky” things investors may do by focusing on volatility? Here are 4 that Buffett mentions and what you should do instead:

1) Keeping long term money in cash.

Many people keep most or even all of the long term money in cash because they're afraid of market volatility. Buffett admits that “owning equities for a day or a week or a year is far riskier (in both nominal and purchasing-power terms) than leaving funds in cash-equivalents,” but he argues that over the long term, “a diversified equity portfolio, bought over time, will prove far less risky than dollar-based securities.” That’s because in the long run, the erosion of the value of your money due to inflation is much more devastating that the short term fluctuations in the stock market.

Average money-market rates are less than a tenth of a percentage point while the average inflation rate last year was 1.6%. That means, the real value of your cash is decreasing by about 1.5% a year. In the short run, that’s a lot less than what you could lose in stocks but in 10 years, your money will have lost almost a quarter of its purchasing power. Compare that to the S&P 500, a selection of 500 of the largest companies in the US, which more than doubled with dividends reinvested over the last 10 years despite the financial crisis in 2008,

Bottom Line: Match your investments to your time frame.

2) Not being adequately diversified.

Another mistake is people having too much in one stock. Often its their employer's stock or the stock received in exchange of a sold company. Sometimes it’s a majority or even all of their money in one stock. There are lots of different reasons. They may know and trust their employer and don’t understand or trust their other options. This stock may have been performing particularly well. The employer stock may be one option out of several in their retirement plan and by spreading their money around, they may inadvertently put too much in their employer stock. They may have acquired the stock as a gift or inheritance or from options, grants, or an employee stock purchase plan and they don’t know what to do with it.

Regardless of the reason, any individual stock (no matter how good the company) is inherently very risky. Unlike what Buffett calls a “diversified equity portfolio” an individual stock can go to zero and never come back. That’s not volatility. That’s a permanent loss of purchasing power.

Bottom Line: Make sure you own a larger number of individual stocks in a a variety of industries or stick to broad-based mutual funds or ETFs that diversify the money for you.

3) Attempting to “time” the market.

Although not thought often as such, this is one of the most common investor mistakes. How many times have you heard people say that they know the market will decline and are waiting until then to jump in. Yes, it’s true that the market will decline at some point. The problem is that no one knows when. 

As Buffett puts it,
“Anything can happen anytime in markets. And no advisor, economist, or TV commentator – and definitely not Charlie nor I – can tell you when chaos will occur. Market forecasters will fill your ear but will never fill your wallet.”
Bottom Line: Instead of trying to time the market (which even Warren Buffett doesn't try to do), make sure you have adequate time IN the market, as that is what matters most. 

4) Active trading.

Instead of trying to time the market, others try to beat it by trading stocks they believe will outperform the market as a whole. This belief can be strengthened if an investor has one or more lucky trades. In many of these situations, the investor mistakes a rising market for his or her investing prowess.

However, many economists believe that the stock market is essentially efficient, which means that it’s extremely difficult if not virtually impossible to beat over the long run. Even if you don’t subscribe to this theory, it’s noteworthy that the vast majority of professional mutual fund managers consistently under-perform the market. Even the few that do outperform over a given time period are actually less likely than average to do so over the next same time period. In other words, any out-performance may be due to luck, exactly what the economists would have predicted.

So if not higher performance, what does all this trading produce? One study found that all this trading costs the average mutual fund about 1.44% per year. That loss comes out of your pocket but is not included in any of the fees reported by mutual funds.

Bottom Line: If professional investment managers, many from top business schools, with access to cutting-edge research and teams of research analysts working for them are unable to consistently beat the market, what makes you think you can? Instead of actively trying to beat the market, limit your trading to making sure your portfolio matches your time frame and risk tolerance, harvest tax losses to offset taxable gains, or switch from higher cost funds to lower cost funds.


_____________________________________________
Clicking the Like button on various social media platforms, such as LinkedIn, Facebook, etc. does not constitute a testimonial for or endorsement of Redmount Capital Partners LLC or any Investment Advisor Representative. “Like” is not meant in the traditional sense. Posts must refrain from recommending investment advisory services or providing testimonials for our firm, since they are strictly prohibited. Please understand that we are required to delete such posts, since this is a regulatory requirement.
Tuesday, September 1, 2015

Bond portfolio risk and reward equilibrium

Most bond investors want income to be high and stable. We think a bond portfolio can be built to strike a balance between both—provided investors are willing to take some risk to do it.

Risk, of course, is the price everyone must pay to achieve returns. But one of the more surprising findings in a study, which surveyed more than 2,000 investors and advisors around the world, was the number of people who seemed to be looking for the investment holy grail: high returns and growth with little or no risk.

When one asks investors about their income expectations, one is told investors want to earn at least 6% per year. But when asked about their priorities, three-quarters of investors surveyed put “growth opportunities” and “principal protection” at the top of their lists. “Amount of income,” cited by 71% of investors as a high priority, was a close third.

There’s nothing remarkable about people wanting the highest possible returns from their portfolios—especially when low interest rates have left investors around the world starved for income. We also understand why those who survived recent crises and gut-wrenching market swings want to minimize risk and preserve the wealth they already have.

But it’s hard to achieve both of these objectives consistently. That’s especially true in the current low-interest-rate environment. Allocations to low-risk assets, such as government bonds and cash, aren’t likely to deliver the level of income investors told us they expect from their portfolios. To generate a sizable income distribution from their portfolios, investors have to take risk.

Diversify with a Multi-Sector Approach

Of course, that doesn’t mean investors should blindly reach for the highest-yielding bonds available. In recent years, we’ve seen investors charge into high-yield securities where the compensation wasn’t always commensurate with the risk—think some CCC-rated junk bonds and parts of the leveraged-loan market.

What’s more, following the crowd into the same credit sectors is dangerous. As we’ve seen, yield-hungry investors have been crowding into—and out of—certain sectors with alarming frequency.

A better approach, in our view, is to embrace a multi-sector strategy that diversifies across sectors, geographies and credit quality. Investors who avoid concentrating their allocations in single-sector funds—high-yield, emerging markets, and so on—can instead allocate to high-income asset classes based on where they or their managers see specific opportunities. This makes it possible to capitalize on undervalued bonds no matter what sector they’re in—and it keeps investors from getting trampled by the crowds when they decide to sell.

Broadening the opportunity set in this way can reduce overall risk and potentially increase risk-adjusted returns. Of course, even a highly-diversified strategy won’t erase risk altogether. The reality is that in today’s low-rate environment, investors must take some calculated risks to earn income from their portfolios that’s as high and stable as possible.

_____________________________________________
Clicking the Like button on various social media platforms, such as LinkedIn, Facebook, etc. does not constitute a testimonial for or endorsement of Redmount Capital Partners LLC or any Investment Advisor Representative. “Like” is not meant in the traditional sense. Posts must refrain from recommending investment advisory services or providing testimonials for our firm, since they are strictly prohibited. Please understand that we are required to delete such posts, since this is a regulatory requirement.