Showing posts with label S&P500. Show all posts

Tuesday, August 1, 2017

Economic Snapshot

Housing: The median home price for Los Angeles County increased 7.4% in June to $569,000, setting a record high. Orange County increased 6.1% in June to $695,000, compared from a year earlier.

Jobs: Data from the California Employment Development Department showed employers reduced their payrolls by 1,400 in June. Unemployment remained at 4.7%, the lowest since November 2000.

LEI: The San Diego Burnham-Moores Center for Real Estate’s Index of Leading Economic Indicators for San Diego reached 144.4 in June, the highest in 17 years. There were 2,100 construction permits issued in June.

Q2 GDP Highlights: The first estimate of Q2 GDP showed GDP increased at a 2.6% annualized rate from the prior quarter. Q1 was revised to 1.2% from 1.4%.

Consumer Spending: Consumer spending increased 2.8% in Q2 according, to data from the Commerce Department.

Wages: The Commerce Department data showed wages and salaries increased 0.5% in Q2, down from a 0.8% increase in Q1.

Federal Reserve: After the last policy meeting the Federal Reserve decided to keep rates unchanged. The Fed still anticipates “gradual” rate hikes however economists are predicting there will be no further rate increases in 2017, unless inflation increases.

Bank Confidence: A Gallup survey found 26% of Americans have “a great deal” or “quite a lot” of confidence in banks. American confidence in banks was 21% in 2012 and 41% in June 2007.

Debt: Data analyzed from the Federal Reserve Bank of New York’s Center for Microeconomic Data Charts showed student loan debt increased 828.3% since 1999. Auto debt increased 137.2% and credit card debt increased 23.6%.

_________
"Data from the Federal Reserve Bank of New York's Center for Microeconimc Data Charts showed student loan debt increased 828.3% since 1999." 

 __________

Clicking the Like button on various social media platforms, such as LinkedIn, Facebook, etc. does not constitute a testimonial for or endorsement of Redmount Capital Partners LLC or any Investment Advisor Representative. “Like” is not meant in the traditional sense. Posts must refrain from recommending investment advisory services or providing testimonials for our firm, since they are strictly prohibited. Please understand that we are required to delete such posts, since this is a regulatory requirement.

Wednesday, July 20, 2016

Dividends...Investors' Search for Value


Dividends. They are one of the first figures investors look for when they believe there is not enough value opportunities in the equities market. 

At the moment, we are currently seeing dividend levels that have not been reached in a very long time. The S&P indicated that the quarterly dividend amount in 4Q15 represented the second largest dividend total in at least ten years. 

On the other hand, the dividend growth rate actually fell to its lowest point since 2011.

"Dividends. They are one of the first figures investors look for when they believe there is not enough value opportunities in the equities market. "

When valuations are uncertain and investors find it too risky to bet on a company’s growth alone, dividends are usually sought in order to ensure a safer return. Many companies even continue disbursing dividends, regardless of how the company is doing financially; simply to maintain investors’ faith in the company. For instance, even though commodities took a big hit in 1Q16, only 12 S&P 500 companies cut or suspended their dividends. However, 919 companies in the U.S. equities market increased their dividend in 1Q16, which was actually 8% lower than during 1Q15.

Though dividend growth is not increasing at the same rate it was just a few years ago, they are still very attractive, especially among more conservative investors or investors who would like to hedge away some of the risk from other investments. 

With interest rates remaining at low levels and thought to remain as such for the time being, dividend rates are providing better returns than government bonds. Though this has become somewhat of a norm, it was not so almost a decade ago. Back then only 5% of stocks in the S&P had higher dividend yields than the 10-year Treasury yield. In the last few years this number has jumped to 65%. At the moment, the S&P dividend yield has about a 20% higher return than the 10-year Treasury. And with dividend yields predicted to stay at current levels for the next couple of years, dividend paying stocks should continue to remain popular among investors; so long as interest rates remain near their current lows as well.

 __________

Clicking the Like button on various social media platforms, such as LinkedIn, Facebook, etc. does not constitute a testimonial for or endorsement of Redmount Capital Partners LLC or any Investment Advisor Representative. “Like” is not meant in the traditional sense. Posts must refrain from recommending investment advisory services or providing testimonials for our firm, since they are strictly prohibited. Please understand that we are required to delete such posts, since this is a regulatory requirement.

Wednesday, November 18, 2015

Monthly Economic Commentary

Economic and market highlights

Economics

The US Federal Reserve left the federal funds rate unchanged in October but adopted a more hawkish tone in its press release, removing references to global financial and economic risks. The implication being that the chances of a December rate rise have increased. The target band remains 0 to 25 basis points. We forecast that the first Federal Reserve interest rate rise for the new tightening cycle will occur in December 2015, which is in line with market consensus.

The Chinese Caixin Flash Purchasing Managers Index (PMI) shows manufacturing activity continues to slow, although the reading was fractionally stronger than anticipated at 48.3, up from 47.2 the previous month. In the eurozone, PMI readings have been relatively robust for most of the year, with October’s registering at 52.3 while after some strong data in the US over the past year, things are looking a little more subdued with the PMI at 50.1 with purchasing managers surveyed citing the strong dollar and energy markets as headwinds.


Source: MWM Research, Caixin, ISM, Markit, November 2015

Deflation in Europe remains a concern with Germany's Harmonised Index of Consumer Prices (HICP) registering a 0.2% fall year-on-year, while import prices fell 3.1%. The Euro area HICP is -0.1% year-on-year with core inflation running at 0.9%.

The latest real GDP figures from China show a 6.9% growth year-on-year, with the announcement after the 5th Plenum reiterating the goal to double China's GDP between 2010 and 2020, implying an average growth rate of 6.5% per year over the next five years.

Canada entered a technical recession in the first half of the year but is expected to return to growth in the third quarter. Australia was sailing close to the wind with a 0.2% quarter-on-quarter growth rate in the June quarter, although we expect a rebound for the third and fourth quarters of 2015 with a pickup in manufacturing output and strong retail trade.

Bonds

The downward trajectory of US 10-year note yields over the last few months looks to be reversing with the latest statements from the Federal Reserve conspicuously removing warnings about global financial and economic risks. Fixed income markets are pricing in a greater chance of a December rate hike after what was perceived to be relatively more hawkish statements. Yields in the United Kingdom, also close to a new rate hike cycle, followed suit. In Europe, while 10-year rates moved, there was very little response at the short end, which remain relatively stable near or below zero due to quantitative easing.

Equities

Equities were broadly stronger in October as they began to shrug off the volatility of August and September. In local currency terms, the strongest developed markets were Germany and Japan, up 11.8 and 10.9% respectively. The US gained 8.1% while Australia lagged, adding only 4.2%. Emerging market equities underperformed developed markets with China rallying 9.1% while the MSCI Emerging Market Index recovered 5.3 percent, dragged down by Brazil, India and Russia.

The S&P500 has staged a dramatic recovery, rallying 11.6% from its September lows and now rests just 1.4% away from new highs.

Currencies

The Canadian dollar and Swiss franc gained 2.4% while the British pound was up a fraction less at 2.0%. The Australian dollar has strengthened 1.6% over the course of October. The Quantitative Easing currencies euro and yen lost 1.0 and 0.8% respectively.

__________________________________________

Clicking the Like button on various social media platforms, such as LinkedIn, Facebook, etc. does not constitute a testimonial for or endorsement of Redmount Capital Partners LLC or any Investment Advisor Representative. “Like” is not meant in the traditional sense. Posts must refrain from recommending investment advisory services or providing testimonials for our firm, since they are strictly prohibited. Please understand that we are required to delete such posts, since this is a regulatory requirement.

Monday, November 16, 2015

10 Charts That Show The U.S. Economy Is Still Underestimated

According to Macquarie analysts David Doyle and Brendan Livingstone there is more to U.S. economy than meets the eye.

"Despite a strong employment report for October, doubts persist in some corners about the resilience of the U.S. economic expansion," they wrote. "We remain confident in the outlook and believe strength should continue in equities with disproportionate exposure to the U.S. economy."

Macquarie is often correct in projecting global and macroeconomic trends. The firm has succeeded as the foremost infrastructure investor, globally, in part by seeing well the big picture.

To this end, Macquarie analysts compiled a list of 10 reasons why the American economy is better than you think.

1. The U.S. manufacturing renaissance is alive

You wouldn't know it from the widely-cited ISM manufacturing purchasing managers' index, which suggests that the secondary sector is barely eking out any growth, but structures investment in this segment is booming:


"Nominal investment in this area is up over 60 percent year-over-year and has more than doubled since 2012," the analysts wrote. "Manufacturers are increasingly building new plants and making improvements to existing plants.

2. Air travel is taking off

Cheap fuel, the lofty U.S. dollar, and an improving economy have served as tailwinds for miles flown domestically and abroad to surge:


"Enplanement growth is accelerating and has reached its fastest pace of growth in five years," wrote Doyle and Livingstone.

3. People are going to restaurants

Another clear beneficiary of the plunge in gas prices: restaurateurs. Nine readings into 2015, the average annual growth is running at roughly its peak rate during the previous cycle:


4. Consumers are increasingly optimistic

A sub-component of the University of Michigan consumer sentiment survey shows that the net percentage of respondents who expect their financial situation to be better in a year has hit its highest level since 2007:


This bodes well for future spending growth, according to the analysts.

5. Workforce entrants come with caps and gowns

"Over the past two years, a net 3.5 million workers with bachelor degrees or higher have entered the labor force, while a net 1.1 million workers with less than this level of education have departed from it," wrote Doyle and Livingstone.


The negative impact that the slowing in labor force additions has on gross domestic product growth may be somewhat offset by higher productivity from these better-educated employees. An environment in which well-educated workers drive labor force growth also augurs well for a reduction in income inequality, as those offering jobs that require fewer prerequisites find that the pool of available workers has shrunk, at least in relative terms.

6. The labor force is tight ...

A survey of Human Resource executives shows companies are having trouble finding new prospects:


Slack in the services sector, by far the dominant portion of the American economy, is particularly scarce, compared to the previous cycle.

7. So new hires are getting pay raises

Unsurprisingly, the dearth of good talent has resulted in new hires getting pay raises "well above the average from 2005 to 2007, yet another sign of a tight labor market," the analysts wrote.


8. Private sector credit growth pushing higher

"While headline consumer credit has been stable at 7 percent year-over-year, this masks firming fundamentals," wrote Doyle and Livingstone. "Credit growth from the federal government and not for profits has been decelerating, while credit growth from private sector for profit lenders has been rising steadily."


9. Robust investment in innovation

The growth in research and development expenditures has eclipsed its pre-recession pace, moving steadily higher since 2012:


10. Producer price inflation is hotter under the hood

While market-based measures of inflation compensation suggest that fears about deflation can remain elevated, producer prices tell a different story. Excluding food and energy, the core producer price index is up a healthy 2.1 percent, year-over-year, Macquarie observes:


Source: Macquarie, Bloomberg

Note: Information contained herein has been obtained from sources believed to be reliable, but Redmount accepts no responsibility or liability (including for indirect, consequential or incidental damages) for any error, omission or inaccuracy of such information. The projections shown are provided for informational purposes only and should not be construed as investment advice or providing any assurance or guarantee as to returns that may be realized in the future from your private equity commitments. Projections and expected returns are subject to high levels of uncertainty regarding future economic and market factors that may affect future performance.Accordingly, such projections/expectations should be viewed as only one possibility out of a broad range of possible outcomes.
__________________________________________

Clicking the Like button on various social media platforms, such as LinkedIn, Facebook, etc. does not constitute a testimonial for or endorsement of Redmount Capital Partners LLC or any Investment Advisor Representative. “Like” is not meant in the traditional sense. Posts must refrain from recommending investment advisory services or providing testimonials for our firm, since they are strictly prohibited. Please understand that we are required to delete such posts, since this is a regulatory requirement.

Tuesday, November 3, 2015

The Opportunity of Stimulated International Small Caps

Additional bond-buying moves by the European Central Bank could extend the rally in the asset class.

Quantitative easing (QE) may be approaching an end in the United States, but the party is just starting in the eurozone. With the European Central Bank’s (ECB) pledge last week to not only continue but also possibly extend, if necessary, its bond-buying program beyond September 16, 2016, market sentiment is improving, and that is supporting the performance of small-cap stocks in the eurozone.

Based on the experience of Japan and the United states, small-cap stocks tend to outperform large caps in the months following the announcements of quantitative easing. The question we posited at the time was, “Would we see a similar response in Europe?” As Chart 1 suggests, if the trend line continues, the eurozone’s small-cap stocks may be well on their way to outperformance.

Chart 1. U.S. and Japanese Small Caps Outperformed after QE—Is Europe Next?
Performance of small-cap stocks relative to large caps in the months following the announcement of quantitative easing, post-2008


Source: Bloomberg.

Moreover, we believe that non-U.S. stocks in general are poised for recovery. The MSCI ACWI ex-US Index (on a price-return basis) peaked on October 7, 2007, and, as Chart 2 indicates, has yet to recover that position, unlike the S&P 500 Index, which benefited from the U.S. Federal Reserve’s quantitative easing following the financial crisis of 2008–09. With quantitative easing just starting in the eurozone, investors should consider the possibility of a similar recovery, if not further gains, in non-U.S. stocks.

Chart 2. Lagging Recovery in Non-U.S. Stocks May Leave Room for Additional Upside
Non-U.S. stock returns versus U.S. stock returns (price return only, as of 10/15/15)


Source: Bloomberg

In terms of small-cap stocks, there is an apparent correlation between small-cap performance and QE, at least in the developed markets, which can be explained by a number of factors peculiar to the small-cap asset class. First, small caps tend to be concentrated in growth-oriented sectors, such as information technology and consumer discretionary, where valuations are pushed up by investors seeking returns in the early stages of recovery. Second, small-cap valuations are supported by the potential for acquisition as larger firms seeking growth take advantage of low borrowing rates during a period of QE to acquire targets. Third, divergent monetary policies in the United States and Europe have weakened the euro versus the U.S. dollar, benefiting eurozone exporters and boosting local economic growth and, thus, small caps, which benefit from the stimulation of local domestic demand.

Because international small-cap stocks are less likely to rise and fall with their U.S. counterparts (and with the broader U.S. market as well), the asset class better lends itself to active management strategies, while it complicates the outlook for more passive investment strategies.

History seldom repeats itself, but often there are discernible patterns. We have seen the positive performance of U.S. and Japanese small caps following QE in those respective regions, and we believe that QE could have similar benefits in the eurozone and in other regions where QE strategies are applied. And so far, the data from the eurozone seem to support our case.

____________________________________________
Clicking the Like button on various social media platforms, such as LinkedIn, Facebook, etc. does not constitute a testimonial for or endorsement of Redmount Capital Partners LLC or any Investment Advisor Representative. “Like” is not meant in the traditional sense. Posts must refrain from recommending investment advisory services or providing testimonials for our firm, since they are strictly prohibited. Please understand that we are required to delete such posts, since this is a regulatory requirement.

Monday, October 12, 2015

Rising Rates. Look closer for opportunities.

After more than six years, the Fed is finally poised to end its zero-interest-rate policy and embark on its first rate hiking cycle in nearly a decade.

We believe this is no ordinary rate cycle – and that the Fed is simply “normalizing” rates from their low levels since the financial crisis. The Fed has also signaled that rate increases will be gradual, which should keep interest rates below historic averages for some time. As a result, we expect rates to rise slowly, remaining below historical averages for some time.

Moreover, we believe that rising rates will be along the strengthening, growing economy – and for well-prepared investors, rising rates can signal opportunity.

A thoughtfully allocated, diversified portfolio can help reduce the impact of rising rates as well as capture growth potential.

1st: Seek a better balance of risk and return

Seek a better balance of risk and return by focusing on credit exposure while reducing interest rate exposure. Corporate bonds typically provide additional yield over Treasuries. Shortening the duration of your bond portfolio can help to reduce your interest rate risk. Combining these actions can be an effective way to navigate a rising rate environment.

Barclays U.S. 1-3 Year Credit Bond Index performance (June 2004 – June 2006)


Source: Barclays as of 8/12/15. Index returns are for illustrative purposes only. Index performance returns do not reflect any management fees, transaction costs or expenses. Indexes are unmanaged and one cannot invest directly in an index.


_____________________________________________
Clicking the Like button on various social media platforms, such as LinkedIn, Facebook, etc. does not constitute a testimonial for or endorsement of Redmount Capital Partners LLC or any Investment Advisor Representative. “Like” is not meant in the traditional sense. Posts must refrain from recommending investment advisory services or providing testimonials for our firm, since they are strictly prohibited. Please understand that we are required to delete such posts, since this is a regulatory requirement.

Friday, September 18, 2015

Redmount’s brief opinion on the Federal Reserve’s (Fed) decision to not move on rates

We think it probably won’t do anything good for markets
  • Attention will now simply shift to “will they/won’t they” for their October meeting.
  • There had been expectations for a “one and done” increase of 0.25%, but that became more and more unlikely given the market tabulations.
  • That said, an increase to the fed funds rate of 0.25% would be a rational response to the probably very slow profile of rate rises over the next 12 to 18 months.
  • Initial rate rises have typically been followed by continued equity market performance on average while the final ones usually brought economic contraction and earnings recessions resulting in stock market losses.
  • And that’s what we’re concerned about, earnings trends. As history suggests, “don’t be afraid of the first interest rate rise, be afraid of the last one
  •  In general, we remain concerned with market volatilities.

Thursday, August 13, 2015

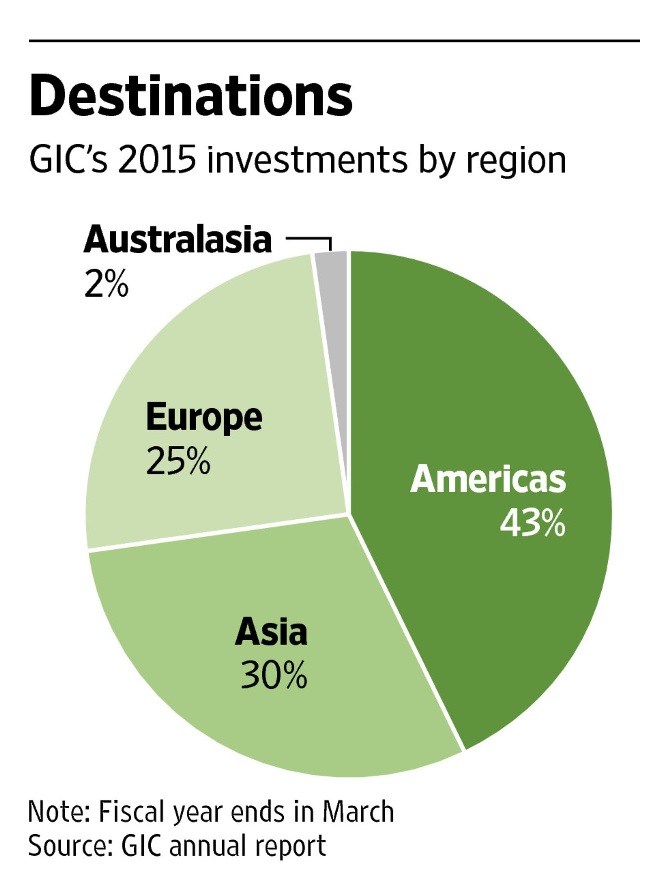
Singapore’s sovereign-wealth fund has warned that it expects lower returns over the next five to ten years

Singapore’s sovereign-wealth fund, one of the world’s biggest and most sophisticated investors, has warned that it expects lower returns over the next five to ten years because global economic growth and earnings don’t look promising.

GIC Pte Ltd., whose largest investments are in North America, said ultralow interest rates have inflated asset prices in developed markets. It said opportunities remained in developed and emerging markets, although it cut its exposure to Europe during Q12015.

“The fall in interest rates to historic lows in most advanced economies has caused prices of a broad range of asset classes to rise,” Lim Chow Kiat, GIC’s group president and chief investment officer, said in the fund’s annual report for the fiscal year that ended in March. “The sharp rise of asset prices, when the global economy is still struggling to gain a firm foothold, makes the investment environment particularly uncertain and unpredictable.”

Even China, which has faced waves of heavy selling in stocks in the past month, remains a long-term investment destination for the fund, GIC said. The fund said it still has a positive view on the economy and believed in the ability of the government to carry out overhauls. Recent volatility is ”fallout of rampant market speculation,” Mr. Lim said.

“China in the last three years has demonstrated its seriousness to reforms and we believe that the country’s future is good," he said.

GIC publishes its annual report following a lengthy audit process. The sovereign-wealth fund is a major global player, and its investments are closely watched. The fund said its investments globally gave it a 4.9% 20-year real rate of return for the fiscal year that ended March 31, or a 6.1% return over the same period in U.S. dollar terms.

_____________________________________________
Clicking the Like button on various social media platforms, such as LinkedIn, Facebook, etc. does not constitute a testimonial for or endorsement of Redmount Capital Partners LLC or any Investment Advisor Representative. “Like” is not meant in the traditional sense. Posts must refrain from recommending investment advisory services or providing testimonials for our firm, since they are strictly prohibited. Please understand that we are required to delete such posts, since this is a regulatory requirement.

Monday, August 3, 2015

Global Economic Environment at the Half-year Mark of 2015

US
Starting with the US economy, which began the year on the wrong foot, we believe the weakness of the first quarter is temporary in nature, mostly due to exceptional factors. US GDP is reported to have contracted by 0.2% in Q1, though there could be revisions to this estimate. The pace of activity was held back by harsh winter conditions, disruptions to ports on the West Coast, reduced energy investment following the decline in oil prices (which subtracted about 0.5 percentage points from Q1 growth), and weaker exports held back by a stronger dollar. Moreover, seasonal adjustment techniques in the official statistics have resulted in Q1 growth systematically reported as much lower than the full-year average.

Both oil prices and the dollar have stabilized; as a consequence, the supply adjustment in energy markets has decelerated: The number of rigs in operation continues to decline but at a much slower pace, and the drag on exports (equivalent to about 0.6 percentage points for every 10% real appreciation) should have largely run its course. Meanwhile, the labor market continues to improve, with new job creation in the non-farm sector running at a 3-month average of about 200,000; the unemployment rate has declined to 5.3%, close to the Congressional Budget Office’s estimate of the non-accelerating inflation rate of unemployment (NAIRU). 

A tighter labor market has begun to exert pressure on wages. The Employment Cost Index accelerated to 2.6% year-over-year in Q1, the highest pace since 2008; wages and salaries were up 5.0% year-over-year in May. Core inflation has remained stable at close to 1.5%; the base effects from lower oil prices will begin to fade by August, and the recent pickup in oil prices will then gradually push headline inflation closer to core; wage pressures are then likely to translate into more significant price increases over the remainder of the year and into 2016. 

Overall, these data make us confident that the US recovery remains on track. This in turn should lead the Fed to hike interest rates later this year, most likely in late Q3 or in Q4. Financial markets have begun to anticipate the likely move, with 10-year Treasury bond yields rising from about 1.64% at the end of January to about 2.35% by the end of June. Markets are, however, pricing a slower pace of monetary policy tightening than the Fed itself has indicated. While the central bank will likely start tightening at a slow pace, it might need to move faster once inflation pressures build up; this would imply an even larger disconnect from current market expectations. 

Europe
Eurozone growth has surprised on the upside in Q1, as we had predicted in our previous Global Macro Shifts publication. At +0.4%, Q1 marked the 8th consecutive quarter of positive quarterover-quarter (qoq) growth. The pickup in economic activity has been spurred, most importantly, by a weaker euro, which has boosted the competitiveness of eurozone exporters. QE by the European Central Bank (ECB) also helped, by reducing funding costs and pushing more liquidity into the banking system. Recent indicators suggest that positive momentum persists: Purchasing manufacturers index, retail sales and lending indicators all remain on an uptrend. 

Though most of the eurozone has seen a broad-based pickup in activity, the sustainability of this varies across countries. Spain, for example, has been outperforming on the back of its reforms and the efforts made to put public finances on a sounder footing. Germany maintains strong international competitiveness, currently buttressed by a healthier domestic demand. Germany’s trade surplus runs at about 7% of GDP, proof of its enduring export prowess. In France and Italy, however, the acceleration seems more cyclical in nature; both countries need a more determined reform effort to accelerate growth on a more sustainable basis. 

The recently launched QE program has successfully begun inverting the previous contraction of the ECB’s balance sheet, which shrank by as much as one third from its peak. Together with existing programs for the purchase of covered bonds and ABS,1 QE has boosted the central bank’s balance sheet by about €200 billion (bn), compared to a target of about €1.1 trillion (tn) as of June 30. Some analysts and market players have speculated that the ECB might abandon its QE program in the near future, given the stronger-than-expected pace of growth. ECB President Mario Draghi, however, has repeatedly emphasized that the bank intends to carry out its program at least until September 2016, and that in any event it would need convincing evidence that inflation is converging to its 2% target in a sustainable way before considering a policy change. 

The Greek saga remains the main cloud on the horizon of the European recovery. Greek voters rejected the latest creditors’ proposal in a referendum held on July 5. The referendum asked voters to either accept or reject the latest economic program that resulted from six months of difficult negotiations with the European Union, ECB and International Monetary Fund (IMF). Eurozone leaders had warned that a “no” vote would most likely result in Greece exiting the eurozone. While negotiations are expected to resume, the risk of “Grexit” has substantially increased. Rather than predicting the outcome of these discussions, we prefer to focus on the possible consequences of the worst-case scenario. Should Greece leave the euro, we believe this would cause a temporary shock to financial markets, with peripheral spreads widening in the eurozone, and a spike in global risk aversion. We are also confident that the eurozone’s current firewalls are strong enough to limit contagion, so that the adverse impact should be limited and temporary in scope. 

Japan 
Japan appears to be finally succeeding in its struggle against deflation. Core CPI is running at about 2%, even subtracting the impact of tax hikes. Even the collapse in oil prices has not been enough to push the country back into deflation, and nominal GDP growth remains on a healthy uptrend. Japan’s success in keeping inflation in positive territory is especially remarkable given the extremely adverse external environment, where many countries have experienced deflationary pressures. This constitutes very encouraging evidence that the “first arrow” of Abenomics, namely a much more decisive QE push, has proved effective. 

The positive impact of Abenomics can be seen on output growth: GDP expanded faster than expected in Q1, at over a 2% qoq seasonally adjusted annualized rate. Inventory accumulation played an important role, but there were also encouraging signs of a rebound in both private consumption and capital expenditures. Moreover, output prices have been running significantly above input prices, indicating that profitability will likely improve, which would support the outlook for a further pickup in investment. Last year’s tax hike, therefore, has not stopped the recovery, contrary to what a number of analysts feared, especially given that a tax hike derailed Japan’s attempt to exit deflation in 1997. This tax hike, the cornerstone of the fiscal strategy, therefore, was a calculated but courageous gamble—and has paid off. This should be considered as another major success of the government’s policy: The “second arrow,” a prudent fiscal policy, promotes confidence in long-term debt sustainability. 

The “third arrow,” structural reforms, remains the most important part of the equation—and has been the focus of most questions and skepticism since the launch of Abenomics. In this area, some important progress has already been made. On the financial side, the portfolio rebalancing of the Government Pension Investment Fund has begun spilling over to other institutions, such as Japan Post and the public employees’ pension funds. Probably more important are efforts to strengthen corporate governance through improving transparency and encouraging a more active role by shareholders and corporate boards. 

Japan’s productivity, after running at about 3% in the 1980s and about 2% in the 1990s, now languishes at a mere 1%. Weak corporate management practices and the ensuing inefficiencies are the main culprits for this productivity slowdown. Japan must boost nominal GDP growth on a durable basis to guarantee the sustainability of its massive debt burden. Besides a permanent rise in the inflation rate, this requires stronger overall real GDP growth. This must be achieved in the face of intensifying demographic pressures, as Japan’s population will continue to age rapidly in the coming decades. Government programs to boost the labor force, in particular by raising female participation, can help, but will not fully offset the impact of aging. To achieve stronger real GDP growth therefore, Japan must achieve faster productivity growth, importantly requiring a strengthening of corporate governance. Japan has therefore adopted a new corporate governance code, which formalizes explicit responsibilities for corporate boards to scrutinize management and communicate information to shareholders, and requires every board to have at least two external directors. Much more work will be needed to increase flexibility and boost productivity, but the measures already taken confirm that the government realizes that it must attempt to tackle the toughest reforms, even if this means clashing with powerful vested interests.

_____________________________________________
Clicking the Like button on various social media platforms, such as LinkedIn, Facebook, etc. does not constitute a testimonial for or endorsement of Redmount Capital Partners LLC or any Investment Advisor Representative. “Like” is not meant in the traditional sense. Posts must refrain from recommending investment advisory services or providing testimonials for our firm, since they are strictly prohibited. Please understand that we are required to delete such posts, since this is a regulatory requirement.

Monday, July 27, 2015

2Q2015 Market Observations


Below is a summary of what took place in the second quarter:

US Equities end flat for the quarter 

  • The S&P 500 returned (0.3%) for the quarter. Small cap outperformed mid and large cap. Mid cap was the weakest performing market cap segment with a negative return of -1.5%. 
  • The growth style outperformed the value style across the market cap spectrum. 
  • The health care and consumer discretionary sectors continue to outpace all other sectors. 
  • Utilities, energy, and industrials continue their negative streak with consumer staples joining the pack. 
  • Momentum and growth continue to be top performing factors while value and quality were weak performers. 
International and emerging market equities manager marginal gains 

  • MSCI EAFE returned 0.6% while MSCI EM returned 0.7% in the quarter. 
  • Small cap stocks outperformed in both international and emerging markets. 
  • In international developed markets, the Far East was the best performing region due to strong performance from Japan. The Pacific was the worst performing region due to Australia and weak commodity prices.
  • Emerging market performance was driven by the BRIC countries ex India. Brazil and Russia bounced off lows while China finished with strong gains despite a reversal late in the quarter.
  • Top and bottom performing sectors in international markets were telecom and financials at the top and health care and information technology at the bottom.
  • In emerging markets the top performing sectors were energy and health care with the bottom performing sectors being information technology and consumer discretionary. 
  • As in the US, momentum and growth were top performing factors in both developed and emerging markets. Beta and value were weaker factors in both developed and emerging markets. 
Global bonds sell off in the quarter 
  • Worries over rising US rates and a Greek default brought about volatility in bond markets. 
  • Long-dated Treasury bonds were the best performing segment of the bond markets as the yield curve steepened during the quarter. 
  • Short-term Treasuries and bank loans were the only positive performing segments during the quarter. 
  • Spreads widened for investment grade and high yield credit, negatively impacting returns. 
  • Non-US bonds posted negative returns except for dollar-denominated emerging market credit. Sovereign debt yields rose while currencies had a mix impact.
_____________________________________________
Clicking the Like button on various social media platforms, such as LinkedIn, Facebook, etc. does not constitute a testimonial for or endorsement of Redmount Capital Partners LLC or any Investment Advisor Representative. “Like” is not meant in the traditional sense. Posts must refrain from recommending investment advisory services or providing testimonials for our firm, since they are strictly prohibited. Please understand that we are required to delete such posts, since this is a regulatory requirement.

Wednesday, July 15, 2015

Investment strategy - Asset Management, 2nd quarter 2015

Deflationary pressures – and the associated risks to growth – are the common enemy faced by most economies across the globe.

At a glance
  • Deflationary pressures – and the associated risks to growth – are the common enemy faced by most economies across the globe. They are the motive behind the ongoing global easing cycle.
  • A stronger US dollar and the resulting foreign exchange market volatility argue for greater differentiation amongst portfolios, in accordance with their reference currency. Hedging has become a must.
  • Euro area investors will benefit from both liquidity injections and the materializing economic recovery – a positive outlook that supports our preference for risky assets over cash.
  • A more balanced approach is required when it comes to US dollar- and Non-US dollar- based portfolios, given the more limited equity market upside.
  • External debt levels and commodity intensity are dividing the emerging economies into two camps: those who can afford to loosen monetary policy (Asia) and those who are forced to keep rates high (Russia, Brazil).
_____________________________________________
Clicking the Like button on various social media platforms, such as LinkedIn, Facebook, etc. does not constitute a testimonial for or endorsement of Redmount Capital Partners LLC or any Investment Advisor Representative. “Like” is not meant in the traditional sense. Posts must refrain from recommending investment advisory services or providing testimonials for our firm, since they are strictly prohibited. Please understand that we are required to delete such posts, since this is a regulatory requirement.

Thursday, June 18, 2015

May June 2015 Market Observations

The US equity markets continue their advance 
• The S&P 500 returned 1.3% for the month. Small cap led the advance. 
• Growth outperformed value in the small and large cap segments. Value outperformed growth in the mid cap segment. 
• Health care and technology were the top performing sectors in the small, mid and large cap segments, supporting the growth indices. The energy sector was the worst performing sector with negative returns, dragging down the value indices. 
• Real assets such as MLPs, REITs and infrastructure were negative performers for the month. 
• Price momentum and Growth factors were the best performing. Quality and value factors were weaker but still positive. 

Weak performance in international and emerging markets for the month 
• International equities, as reflected by the MSCI EAFE Index, finished the month with a return of -0.5% in USD terms, underperforming the US market. Japan outperformed Europe as per the MSCI Japan Index return of 5.0% versus the MSCI Europe Index which returned -0.8% in USD terms. 
• Emerging markets, as reflected by MSCI EM Index, returned -4.0% for the month in USD terms. EM Eastern Europe and Latin America were the worst performing EM regions. 
• The energy sector was the weakest performing in both non-US developed and emerging markets. 
• Price momentum was clearly the top performing factor in developed markets. Quality was the top performing factor in emerging markets. The weakest performing factors were value in both developed and emerging markets. 

High yield credit was lone bright spot in fixed income 
• High yield credit was the best performing fixed income segment for the month. Only high yield, leveraged loans and short duration Treasuries posted positive returns (with the exception of CCC-rated credit, which was slightly down for the month). 
• Long duration Treasuries was the worst performing fixed income segment followed by investment grade credit. 
• Most major currencies depreciated relative to the US dollar during the month. The main exception was the Renminbi. 
• Currency depreciation hurt the performance of non-dollar bonds after a strong month in April.

Market information source: Bloomberg.

_____________________________________________
Clicking the Like button on various social media platforms, such as LinkedIn, Facebook, etc. does not constitute a testimonial for or endorsement of Redmount Capital Partners LLC or any Investment Advisor Representative. “Like” is not meant in the traditional sense. Posts must refrain from recommending investment advisory services or providing testimonials for our firm, since they are strictly prohibited. Please understand that we are required to delete such posts, since this is a regulatory requirement.

Tuesday, May 12, 2015

U.S. cash balances remain high


Investors are continuing to hoard cash and keep more and more capital in short-term assets.

Source: Investment Company Institute data, Federal Reserve, and Bloomberg. *Total cash and short-term assets include money market assets (ICI), large time deposits, all commercial banks, NSA (not seasonally adjusted), savings deposits, and small time deposits.

_____________________________________________
Clicking the Like button on various social media platforms, such as LinkedIn, Facebook, etc. does not constitute a testimonial for or endorsement of Redmount Capital Partners LLC or any Investment Advisor Representative. “Like” is not meant in the traditional sense. Posts must refrain from recommending investment advisory services or providing testimonials for our firm, since they are strictly prohibited. Please understand that we are required to delete such posts, since this is a regulatory requirement.


Thursday, May 7, 2015

FAQs on Greek debt default

Today European Central Bank gave Greece another week to make a deal or tighter liquidity rules will be imposed on its banks. And this is just a start.

The summer of 2015 will bring renewed drama around Greek debt and potential default, Greece has to come up with about 4 billion euros ($4.5 billion) by the end of May for debt payments. Then there’s the 1.5 billion-euro monthly tab for salaries and pensions.

As Prime Minister Alexis Tsipras’s government in Athens haggles over the details of its reforms and leans on its banks to keep buying Treasury bills, the question inevitably looms: what happens if the cash runs out?

Not all creditors are created equal. For example, the International Monetary Fund is more equal than others, first in the repayment queue.

We found the Q&A session conducted by Bloomberg View Columnist Mark Gilbert with Mizuho International Chief European Economist Riccardo Barbieri to be of great value for frequently asked questions (FAQs) related to Greek debt, its potential default, and the probable processes triggered by a default.

Here are the key Q&As for your review.

Q: What is a default?
A: Investopedia.com defines default as “the failure to promptly pay interest or principal when due. Default occurs when a debtor is unable to meet the legal obligation of debt repayment.”

Q: How much debt does Greece have?
A: The Greek government has about 313 billion euros of debt outstanding, most due after 2021. Add companies and banks and the total is closer to half a trillion. Given that Greek banks are likely to refinance most of the maturing Treasury bills without protest -- with pension funds and local governments making up the shortfall -- the important near-term deadlines are May 6 and May 12, when the IMF is due to receive almost 1 billion euros in total. The real crunch comes midyear, when almost 7 billion euros of bonds held by the European Central Bank mature in July and August.

Q: What happens if the IMF isn’t paid?
A: A missed payment date starts the clock ticking. Two weeks after the initial due date and a cable from Washington urging immediate payment, the fund sends another cable stressing the “seriousness of the failure to meet obligations” and again urges prompt settlement. Two weeks after that, the managing director informs the Executive Board that an obligation is overdue. For Greece, that’s when the serious consequences kick in. These are known as cross-default and cross-acceleration.

Q: What are cross-default and cross-acceleration?
A: Failure to pay the IMF would entitle some of Greece’s other creditors, including the European bailout fund, to declare a default. They would then have the option to demand immediate repayment of all their loans, a process known as acceleration. Other lenders could then follow suit. While calling a default preserves creditors’ claims, acceleration -- the bit that hurts -- isn’t automatic. Each creditor decides on its own. To varying degrees the debt is linked in a web of cross-default and cross-acceleration clauses that make it safe to assume that one default and acceleration would trigger demands for repayment on most, if not all, of the rest. Greek debt features a variety of structures, with different terms and conditions and governed principally by Greek and English law. The obligations include bonds whose holders voted not to take part in a 2012 restructuring; notes issued in that restructuring; bonds held by the ECB; a series of loans from Europe’s bailout fund, including one used to sweeten the restructuring pill; notes issued last year; the 2010 Greek Loan Facility; and the IMF loans.

Q: What about credit-default swaps?
A: The determinations committee of the International Swaps & Derivatives Association, the trade association that administers derivative contracts, must first receive a request for a ruling on what should happen to CDS contracts. It then makes a binding decision on whether a “credit event” has occurred, which may trigger the contracts. There are now 622 contracts open, covering a net $592 million, according to Depository Trust & Clearing Corp., which runs a data warehouse. In 2012, the contracts paid out after the country’s debt restructuring, which was the biggest ever.

Q: What would default do to Greek banks?
A: That depends on the attitude of the ECB and on the default itself. With lenders losing deposits, only a drip-feed of Emergency Liquidity Assistance supplied by the Bank of Greece against deteriorating collateral is keeping them afloat. While ECB President Mario Draghi indicated last week that ELA would continue as long as the lenders are solvent and have adequate collateral, bank solvency, especially of lenders using ELA, is very much a judgement call, says Gabriel Sterne, head of global macro research at Oxford Economics in London. Failure to repay the ECB in July and August would probably result in the suspension of ELA, according to Chris Attfield, a strategist at HSBC Holdings Plc in London. Any interruption in ELA would almost certainly trigger a fully fledged bank run, forcing the imposition of capital controls. If the banks themselves are victims of the default after, say, a failed Treasury bill auction, then their insolvency would probably ensue and ELA would end.

Q: How would capital controls work?
A: In Greece, not so well. Unlike the island of Cyprus, which this year lifted controls implemented two years ago, Greece has porous borders and mobile citizens. While controls would stop capital flight via the banks, there is still the cash residents have withdrawn.

Q: We hear a lot about Target2. What’s that?
A: It’s the payment system established by the ECB that allows euros created by each national central bank to flow freely in the 19-nation currency bloc. In 2013, an average 1.9 trillion euros of transactions per day were processed, according to the ECB website. It also keeps track of who owes what to whom and at the end of March, Greece was in the hole to its partners for 96 billion euros, or more than 40 percent of economic output, according to the Bank of Greece. Courtesy of Target2, money created in Athens is circulating in Paris and Berlin after paying for Peugeot cars and Bayer AG’s asprin. As long as Greece remains officially in the euro zone -- even if a parallel currency circulates -- the nation’s Target2 liabilities are a political concern, not a financial one. However, loss of access to Target2 “would crystallize the liability,” said John Whittaker, a fellow of Lancaster University Management School who has published on European payment systems. “The other central banks would then have losses in proportion to their share of the ECB’s capital.”

Q: What about Greek companies?
A: A sovereign default would probably be followed by corporate defaults. Greek assets overseas would be fair game for creditors, though there aren’t many to grab. The former Coca-Cola Hellenic Bottling Co., the world’s second-largest Coca-Cola bottler, for example, is now called Coca-Cola HBC AG and is headquartered in Switzerland. Also, capital controls would probably be accompanied by other measures, such as orders for companies to repatriate euros held overseas and prohibitions on dividend payments. The government might also introduce IOUs to substitute the missing euros -- in 2010 it slashed the price it would pay drug suppliers and then paid them with bonds.

Q: Could Greece default and remain in the euro?
A: Exiting the euro would only be possible if Greece left the European Union, according to Yannis Manuelides at Allen & Overy. “The euro is an integral part of the union and it’s meant to be a one-way street,” he said. “There is no way to expel a member and to allow or force an exit would be very bad for the EU. They will do everything they can to avoid it.” That may not be enough: According to Benedict James, a banking partner at Linklaters, capital controls would be “a staging post to an exit.” James agrees that the only way for Greece to leave the euro would be to exit the EU altogether. In sum, Greece leaving the euro is likely to be messy, lengthy and painful for all concerned, with the Greeks suffering more than their partners and the lawyers profiting. The real deadline is in June, when national parliaments start to head off for the summer break, said Zsolt Darvas, a fellow at the Bruegel think tank in Brussels who reckons that Greece will be able to scrape by for now.

_____________________________________________
Clicking the Like button on various social media platforms, such as LinkedIn, Facebook, etc. does not constitute a testimonial for or endorsement of Redmount Capital Partners LLC or any Investment Advisor Representative. “Like” is not meant in the traditional sense. Posts must refrain from recommending investment advisory services or providing testimonials for our firm, since they are strictly prohibited. Please understand that we are required to delete such posts, since this is a regulatory requirement.

Thursday, April 30, 2015

Is the Corporate M&A Bubble in Trouble?

We think its not...yet. The current level of activity suggests that corporate managers will continue to buy rather than build.

In a recent CNBC poll, some 56% of companies said that they plan an acquisition in the coming year, up from 40% last October and the first time since 2010 that more than half plan to do something. But even if such plans were to generate a surge later this year, it would make a bullish argument for equities, not the bearish one accompanying much of this recent buzz.

M&A, quite simply, is a vote of confidence in market values and the future generally. Companies buy each other when they see a reason to expand and when other firms look attractively cheap. The same goes for private equity, which is no less in the acquisition business than corporations. If these decision makers saw stocks as expensive, they would pursue their expansion with direct investments in new equipment, premises, and in a hiring program. Since they are buying these days and doing relatively little building, they have effectively announced that stock values still make a purchase the more attractive way to expand.

Table 1. M&A Activity (monthly rates)
Period
Number of Deals
Value ($ in bil.)
2013 4Q
817
$79.6
2014 1Q
959
$108.7
         2Q
1,000
 154.8
         3Q
1,003
 108.1
October
1,123
 96.5
November
1,006
 194.0
December
983
 103.6
2015 January
995
$78.4
        February
938
114.3

Source: FactSet

_____________________________________________

Clicking the Like button on various social media platforms, such as LinkedIn, Facebook, etc. does not constitute a testimonial for or endorsement of Redmount Capital Partners LLC or any Investment Advisor Representative. “Like” is not meant in the traditional sense. Posts must refrain from recommending investment advisory services or providing testimonials for our firm, since they are strictly prohibited. Please understand that we are required to delete such posts, since this is a regulatory requirement.

Tuesday, April 28, 2015

Top geopolitical risks to watch for

Synopsis of Eurasia Group's Top Risks 2015 

1 - The Politics of Europe
Europe's economics are in substantially better shape than at the height of the Eurozone crisis. But the politics is now much worse. That's true on three different levels: bottom-up, intra-EU, and outside-in.

2 - Russia
Last year, we highlighted Russia as one of the top risks to global security--that was before Moscow carried out the most brazen redrawing of European borders since World War II, and then fell into a severe currency crisis. The conflict with the West over Ukraine has crystallized a newly aggressive and explicitly anti-Western Russian foreign policy. Western sanctions, a sagging oil price, economic stagnation, and the ruble's plunge are weakening Russia economically and financially, though not driving it to the point of crisis. 

3 - The Effects of China Slowdown
We're quite optimistic about China this coming year. President Xi Jinping has consolidated an extraordinary amount of power since ascending to the presidency. He has launched policies long overdue to rebalance the economy, pushing ahead on improving air quality, pursuing a series of measures aimed at making state-owned enterprises more efficient and spearheading a massive anticorruption campaign within the Communist Party.

4 - Weaponization of Finance
The United States remains the world's only superpower, but Washington is now using its influence in important new ways. After World War II, American dominance was established by the forging of us-led alliances such as NATO and multilateral institutions such as the IMF and the World Bank that enshrined US-authored rules and standards.

5 - ISIS, Beyond Iraq and Syria

In 2015, ISIS faces setbacks in its core bases in Iraq and Syria, but its military power remains significant, and its ideological reach will spread throughout the Middle East and North Africa. It will grow organically by setting up new units in Yemen, Jordan, and Saudi Arabia, and it will inspire many jihadist organizations to join its ranks. Ansar Bayt al Maqdas in Egypt and Islamists in the Libyan city of Derna have already pledged allegiance to ISIS leader Abu Bakr al Baghdadi.

6 - Weak Incumbents
Political risk stemming from weak incumbents who recently won reelection will weigh on key markets in 2015. With the important exceptions of India and Indonesia, the wave of emerging market elections in 2014 saw incumbents win underwhelming victories. Sluggish growth and mounting popular demands were not enough to displace ruling party candidates in Brazil, Colombia, South Africa, and Turkey, and are unlikely to do so in Nigeria in 2015.

7 - The Rise of Strategic Sectors
In 2015, success and failure for business will depend increasingly on governments. For decades, the perception was that multinational companies were developing greater autonomy from policymakers, both in their home governments and in the countries where they operate, eroding state authority to regulate the flow of goods and services around the world. Instead, government influence is expanding, focused more on political stability than on economic growth.

8 - Saudi Arabia vs. Iran
Saudi-Iran tensions will spike during 2015, worsening the Sunni-Shia sectarian rift across the region.
The relationship will be especially volatile this year because: 1) there will be an unprecedented number of theaters of proxy conflict 2) domestic politics in both countries will enhance conflict and 3) the evolution of diplomacy on Iran's nuclear program, regardless of the outcome, will provoke more strife between Riyadh and Tehran. 

9 - Taiwan/China
Relations between China and Taiwan will deteriorate sharply in 2015 following the opposition Democratic Progressive Party's (DPP's) landslide victory over the ruling nationalist party in November's local elections. Taiwan's political class will focus overwhelmingly this year on throwing elbows at one another ahead of the 2016 presidential election. President Ma Ying-Jeou is already a lame duck, and we expect no progress toward an agreement with China on any form of trade liberalization.

10 - Turkey
For the second year in a row, Turkey makes our list. Lower oil prices have been good news for this country, but that's about all that's going well. Heavy-handed rule, short-sighted political decisions, and bad foreign policy bets will all conspire against Turkey. At home, Erdogan has used election victories in 2014 to ensure decisive defeat of his political enemies (of which there are many) while remaking the country's political system to tighten his hold on power.

Red Hearing 1 - Asia Nationalism
Red Hearing 2 - The Islamic State
Red Hearing 3 - Petrostates
Red Hearing 4 - Mexico

_____________________________________________
Clicking the Like button on various social media platforms, such as LinkedIn, Facebook, etc. does not constitute a testimonial for or endorsement of Redmount Capital Partners LLC or any Investment Advisor Representative. “Like” is not meant in the traditional sense. Posts must refrain from recommending investment advisory services or providing testimonials for our firm, since they are strictly prohibited. Please understand that we are required to delete such posts, since this is a regulatory requirement.

Thursday, April 16, 2015

The effects of bulging corporate purses.


High cash levels, accumulated by S&P 500 corporations, are being put to work. Above charts are showing growing levels of capital expenditures, M&A activities, dividends, and stock buybacks by the nation's largest corporations.

If sustainable, this will benefit the economy. Capital expenditures can add to the industrial growth. Dividends and stock buybacks will probably add to consumer spending and housing sector strength. Corporate mergers and acquisition activities may strengthen equity markets.

_____________________________________________
Clicking the Like button on various social media platforms, such as LinkedIn, Facebook, etc. does not constitute a testimonial for or endorsement of Redmount Capital Partners LLC or any Investment Advisor Representative. “Like” is not meant in the traditional sense. Posts must refrain from recommending investment advisory services or providing testimonials for our firm, since they are strictly prohibited. Please understand that we are required to delete such posts, since this is a regulatory requirement.


Monday, April 13, 2015

Factors shaping investment markets. April 2015.


Deflationary pressures – and the associated risks to growth – are the common enemy faced by most economies across the globe. They are the motive behind the ongoing global easing cycle.

A stronger U.S. dollar and the resulting foreign exchange market volatility argue for greater differentiation amongst portfolios, in accordance with their reference currency. Hedging has become a must.

Euro markets will benefit from both liquidity injections and the materializing economic recovery – a positive outlook that supports our preference for risky assets over cash.

A more balanced approach is required when it comes to U.S. dollar- and Swiss franc-based portfolios, given the more limited equity market upside.

External debt levels and commodity intensity are dividing the emerging economies into two camps: those who can afford to loosen monetary policy (Asia) and those who are forced to keep rates high (Russia, Brazil).

_____________________________________________
Clicking the Like button on various social media platforms, such as LinkedIn, Facebook, etc. does not constitute a testimonial for or endorsement of Redmount Capital Partners LLC or any Investment Advisor Representative. “Like” is not meant in the traditional sense. Posts must refrain from recommending investment advisory services or providing testimonials for our firm, since they are strictly prohibited. Please understand that we are required to delete such posts, since this is a regulatory requirement.

Monday, March 2, 2015

Is the deleveraging over?


Economic growth may go into higher gear if U.S. households are finally done deleveraging  There may still be room for more deleveraging as well. These processes may impact inflation, interest rates, commodities, retail and housing activities, equity markets, debt markets, etc.

The charts above (click to enlarge) look at the current state of consumer finances. The chart on the left shows the makeup of the household "balance sheet" and the top right chart shows what percentage of disposable income is spent on debt service, highlighting the consumer deleveraging we have observed over the past few years. The chart on the bottom right looks at household net worth, which is the sum of all assets, including home equity, less all liabilities.

Chart: Market Insights. 1Q 2015. JP Morgan Asset Management

_____________________________________________
Clicking the Like button on various social media platforms, such as LinkedIn, Facebook, etc. does not constitute a testimonial for or endorsement of Redmount Capital Partners LLC or any Investment Advisor Representative. “Like” is not meant in the traditional sense. Posts must refrain from recommending investment advisory services or providing testimonials for our firm, since they are strictly prohibited. Please understand that we are required to delete such posts, since this is a regulatory requirement.

Wednesday, February 18, 2015

Is the fiscal situation in Greece a global threat?

In reality the fiscal situation in Greece is not a global economic threat. Greece is only going through a debt crisis.

To evaluate the matter, it is important to differentiate between the stock of debt and the flow of new debt.

We should not be complacent about the stock of debt: it is high and probably unsustainable at 180% of GDP. Even with higher growth of economy this level of debt would be a challenge. Greece's growth is very low, demographics are unsupportive, productivity is very week. However, we should not forget that Greek debt has already been significantly restructured in such a way that it is manageable in the short-term. Altogether, current high level of Greek debt is a threat to Greece. It will probably impact its creditors as well.

On the other hand, Greek debt flows fundamentals have exceptionally improved, and have been strong. What Greeks did is almost unprecedented. Within five years, they turned their government primary balance to a surplus. Similarly, their current account, over the same period, went from a deficit of 115 to a surplus of over 1%.

So, we have a country that runs a primary budget surplus and a current account surplus, but where, partly because of austerity, there is no growth possible. Hence, the stock of debt crisis only. It can add to market volatility. If poorly handled by Eurozone powers, it can result in Euro weakness. This will hardly result in global economic threat.