Tuesday, August 18, 2015

Unlocking resources through better corporate cash management

Companies call on the full resources of their cash management, as they need to grow, execute CapEx or acquisitions.

But going an extra step gives financial managers a chance to help benefit their organization in a less-than-usual way.

The financial manager has an excellent opportunity to contribute strategically to a company's growth, by demonstrating how working capital can be leveraged to serve as a financing and risk management tool in conjunction with, or in addition to, traditional funding methods. This can help strengthen the capital plan and help improve the debt structure.

The benefits of freeing up cash to grow a company:

Reduced financing requirements
  • Existing cash is typically the cheapest form of financing. Using it to finance growth, including for CapEx or acquisitions, can reduce the external financing expense of stock or bond issuance. 
  • The cash released from
    working capital in this instance, should be valued at a weighted average cost of capital (WACC) or, alternatively, the cost of financing the growth should be included in the capital plan typically developed by the financial management team. 
  • In the example above, established working capital standards, can guide a company to release a sizable amount of cash, which applied at a well structured WACC can generate benefit for the company.


Look out for financial ratios and credit ratings
  • Credit rating agencies like D&B review company balance sheets. 
  • Rating agencies usually look upon increases in free cash flow as a positive factor during this process; however, it’s important to note that agencies may penalize companies that ineffectively manage their working capital compared to their peers.
A positive impact on company strength and valuation
  • When looking at a discounted cash flow valuation, the release of working capital that can be achieved by the company would translate as an increase in cash, ultimately improving the valuation of the company.
  • This needs to be looked at carefully and conservatively to ensure that all improvements can indeed be achieved; the finance team is in a prime position to evaluate this.
  • When using weighted average cost of capital, including working capital release in the calculation may boost a company's financials through a one-off increase in free cash flow.
  • Although working capital is priced into a corporate acquisition, the full potential of the synergies often go unrealized when the treasury team, which handles working capital daily, isn’t involved early in negotiations.
  • Working capital is often looked at with more detail in private equity deals, as it is the goal of financial sponsors to maximize asset allocation and drive quick shareholder returns.
More funds for growth
  • Cash unlocked from working capital may help a company grow more quickly, facilitating integration and reducing the execution risk from a cash flow requirement perspective.
  • Strategic events such as mergers, acquisitions, sales, reorganization, etc. provide the perfect opportunity to review the working capital position of the company. 
  • Although the review of working capital and improved management of cash may require some efforts, (improve processes, deploy new banking solutions, and change policies), uncovering these funds can sometimes can release sizable cash to the company's balance sheet.

Released cash can add up quickly

Even a one-day improvement in working capital management parameters can have a profound impact and the finance management leadership plays an important role in this.

Working capital release techniques could be bank-led solutions such as factoring, supply chain finance and card solution, or internal re-engineering such as supplier and customer payment terms standardization. A centralized liquidity structure automated at an in-house bank level can also move the needle in terms of the funding mix of long-term versus short-term debt structures.

As another internal example, larger companies execute ‘payment runs’ on a weekly or fortnightly basis. As these payment files usually are designed to have all payments processed on that same day, the company often ends up paying invoices earlier than their due date (invoices due in the following
week or two) to avoid the cost of executing daily payment runs. Changing this process so that payments are ‘warehoused’ at the bank level until the invoice due date can be a quick and easy way to release working capital, often resulting in a three-day extension of Days Payables Outstanding.

The example above illustrates how the finance manager’s knowledge of the organization’s cash flow can help establish what the achievable extension of company's days payable outstanding is, and therefore, what the subsequent reduction in the cash conversion cycle would be.

Best practices to consider
  • Involve finance staff as often as possible in to decision-making process.
  • In M&A situations finance team can propose the use of cash from working capital as a funding option.
  • Identify the focus areas for working capital release.
  • Prioritize the deployment of processes and policies, which can quickly release cash from the working capital to accelerate the funding growth.
  • Centralize treasury operations: consider using shared service centers to standardize payments flows and leverage funding from an in-house bank with automated cash concentration structures.
  • Hand off functions to banks, such as the financing of some of the strategic suppliers through a supply chain finance program, or the management of some local processes (such as payment file translations).

Note: Calculations of Working Capital used for the examples in this document follow the bellow formulas:

Days Payable Outstanding [DPO] = (Trade Accounts Payable / Cost of Goods Sold) * 365
Days Receivable Outstanding [DSO] = (Trade Accounts Receivable / Revenue) *365
Days Inventory Outstanding [DIO] = (Inventory / Revenue) * 365
Cash Conversion Cycle [CCC] = DSO – DPO + DIO

_____________________________________________
Clicking the Like button on various social media platforms, such as LinkedIn, Facebook, etc. does not constitute a testimonial for or endorsement of Redmount Capital Partners LLC or any Investment Advisor Representative. “Like” is not meant in the traditional sense. Posts must refrain from recommending investment advisory services or providing testimonials for our firm, since they are strictly prohibited. Please understand that we are required to delete such posts, since this is a regulatory requirement.

Thursday, August 13, 2015

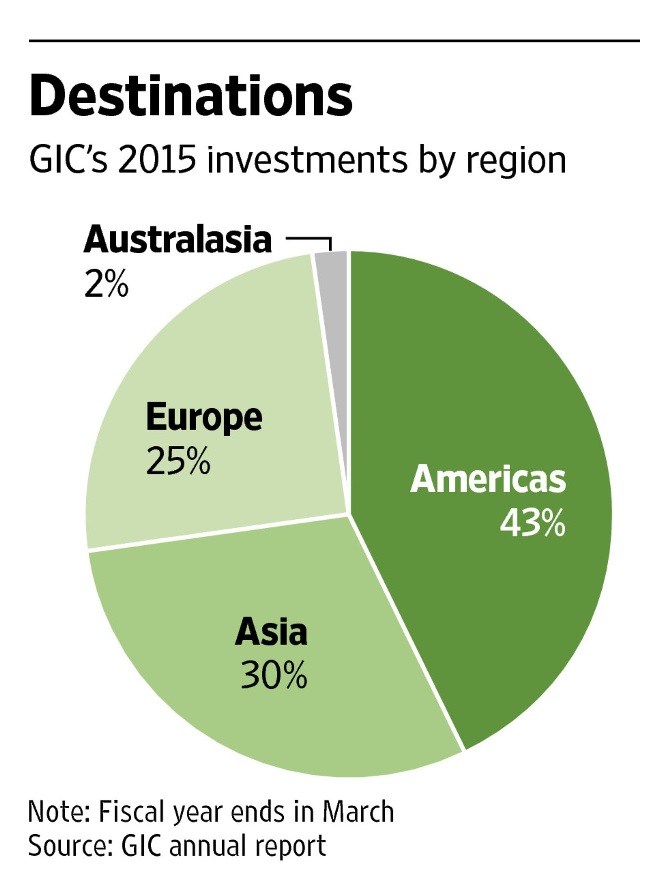
Singapore’s sovereign-wealth fund has warned that it expects lower returns over the next five to ten years

Singapore’s sovereign-wealth fund, one of the world’s biggest and most sophisticated investors, has warned that it expects lower returns over the next five to ten years because global economic growth and earnings don’t look promising.

GIC Pte Ltd., whose largest investments are in North America, said ultralow interest rates have inflated asset prices in developed markets. It said opportunities remained in developed and emerging markets, although it cut its exposure to Europe during Q12015.

“The fall in interest rates to historic lows in most advanced economies has caused prices of a broad range of asset classes to rise,” Lim Chow Kiat, GIC’s group president and chief investment officer, said in the fund’s annual report for the fiscal year that ended in March. “The sharp rise of asset prices, when the global economy is still struggling to gain a firm foothold, makes the investment environment particularly uncertain and unpredictable.”

Even China, which has faced waves of heavy selling in stocks in the past month, remains a long-term investment destination for the fund, GIC said. The fund said it still has a positive view on the economy and believed in the ability of the government to carry out overhauls. Recent volatility is ”fallout of rampant market speculation,” Mr. Lim said.

“China in the last three years has demonstrated its seriousness to reforms and we believe that the country’s future is good," he said.

GIC publishes its annual report following a lengthy audit process. The sovereign-wealth fund is a major global player, and its investments are closely watched. The fund said its investments globally gave it a 4.9% 20-year real rate of return for the fiscal year that ended March 31, or a 6.1% return over the same period in U.S. dollar terms.

_____________________________________________
Clicking the Like button on various social media platforms, such as LinkedIn, Facebook, etc. does not constitute a testimonial for or endorsement of Redmount Capital Partners LLC or any Investment Advisor Representative. “Like” is not meant in the traditional sense. Posts must refrain from recommending investment advisory services or providing testimonials for our firm, since they are strictly prohibited. Please understand that we are required to delete such posts, since this is a regulatory requirement.

Monday, August 3, 2015

Global Economic Environment at the Half-year Mark of 2015

US
Starting with the US economy, which began the year on the wrong foot, we believe the weakness of the first quarter is temporary in nature, mostly due to exceptional factors. US GDP is reported to have contracted by 0.2% in Q1, though there could be revisions to this estimate. The pace of activity was held back by harsh winter conditions, disruptions to ports on the West Coast, reduced energy investment following the decline in oil prices (which subtracted about 0.5 percentage points from Q1 growth), and weaker exports held back by a stronger dollar. Moreover, seasonal adjustment techniques in the official statistics have resulted in Q1 growth systematically reported as much lower than the full-year average.

Both oil prices and the dollar have stabilized; as a consequence, the supply adjustment in energy markets has decelerated: The number of rigs in operation continues to decline but at a much slower pace, and the drag on exports (equivalent to about 0.6 percentage points for every 10% real appreciation) should have largely run its course. Meanwhile, the labor market continues to improve, with new job creation in the non-farm sector running at a 3-month average of about 200,000; the unemployment rate has declined to 5.3%, close to the Congressional Budget Office’s estimate of the non-accelerating inflation rate of unemployment (NAIRU). 

A tighter labor market has begun to exert pressure on wages. The Employment Cost Index accelerated to 2.6% year-over-year in Q1, the highest pace since 2008; wages and salaries were up 5.0% year-over-year in May. Core inflation has remained stable at close to 1.5%; the base effects from lower oil prices will begin to fade by August, and the recent pickup in oil prices will then gradually push headline inflation closer to core; wage pressures are then likely to translate into more significant price increases over the remainder of the year and into 2016. 

Overall, these data make us confident that the US recovery remains on track. This in turn should lead the Fed to hike interest rates later this year, most likely in late Q3 or in Q4. Financial markets have begun to anticipate the likely move, with 10-year Treasury bond yields rising from about 1.64% at the end of January to about 2.35% by the end of June. Markets are, however, pricing a slower pace of monetary policy tightening than the Fed itself has indicated. While the central bank will likely start tightening at a slow pace, it might need to move faster once inflation pressures build up; this would imply an even larger disconnect from current market expectations. 

Europe
Eurozone growth has surprised on the upside in Q1, as we had predicted in our previous Global Macro Shifts publication. At +0.4%, Q1 marked the 8th consecutive quarter of positive quarterover-quarter (qoq) growth. The pickup in economic activity has been spurred, most importantly, by a weaker euro, which has boosted the competitiveness of eurozone exporters. QE by the European Central Bank (ECB) also helped, by reducing funding costs and pushing more liquidity into the banking system. Recent indicators suggest that positive momentum persists: Purchasing manufacturers index, retail sales and lending indicators all remain on an uptrend. 

Though most of the eurozone has seen a broad-based pickup in activity, the sustainability of this varies across countries. Spain, for example, has been outperforming on the back of its reforms and the efforts made to put public finances on a sounder footing. Germany maintains strong international competitiveness, currently buttressed by a healthier domestic demand. Germany’s trade surplus runs at about 7% of GDP, proof of its enduring export prowess. In France and Italy, however, the acceleration seems more cyclical in nature; both countries need a more determined reform effort to accelerate growth on a more sustainable basis. 

The recently launched QE program has successfully begun inverting the previous contraction of the ECB’s balance sheet, which shrank by as much as one third from its peak. Together with existing programs for the purchase of covered bonds and ABS,1 QE has boosted the central bank’s balance sheet by about €200 billion (bn), compared to a target of about €1.1 trillion (tn) as of June 30. Some analysts and market players have speculated that the ECB might abandon its QE program in the near future, given the stronger-than-expected pace of growth. ECB President Mario Draghi, however, has repeatedly emphasized that the bank intends to carry out its program at least until September 2016, and that in any event it would need convincing evidence that inflation is converging to its 2% target in a sustainable way before considering a policy change. 

The Greek saga remains the main cloud on the horizon of the European recovery. Greek voters rejected the latest creditors’ proposal in a referendum held on July 5. The referendum asked voters to either accept or reject the latest economic program that resulted from six months of difficult negotiations with the European Union, ECB and International Monetary Fund (IMF). Eurozone leaders had warned that a “no” vote would most likely result in Greece exiting the eurozone. While negotiations are expected to resume, the risk of “Grexit” has substantially increased. Rather than predicting the outcome of these discussions, we prefer to focus on the possible consequences of the worst-case scenario. Should Greece leave the euro, we believe this would cause a temporary shock to financial markets, with peripheral spreads widening in the eurozone, and a spike in global risk aversion. We are also confident that the eurozone’s current firewalls are strong enough to limit contagion, so that the adverse impact should be limited and temporary in scope. 

Japan 
Japan appears to be finally succeeding in its struggle against deflation. Core CPI is running at about 2%, even subtracting the impact of tax hikes. Even the collapse in oil prices has not been enough to push the country back into deflation, and nominal GDP growth remains on a healthy uptrend. Japan’s success in keeping inflation in positive territory is especially remarkable given the extremely adverse external environment, where many countries have experienced deflationary pressures. This constitutes very encouraging evidence that the “first arrow” of Abenomics, namely a much more decisive QE push, has proved effective. 

The positive impact of Abenomics can be seen on output growth: GDP expanded faster than expected in Q1, at over a 2% qoq seasonally adjusted annualized rate. Inventory accumulation played an important role, but there were also encouraging signs of a rebound in both private consumption and capital expenditures. Moreover, output prices have been running significantly above input prices, indicating that profitability will likely improve, which would support the outlook for a further pickup in investment. Last year’s tax hike, therefore, has not stopped the recovery, contrary to what a number of analysts feared, especially given that a tax hike derailed Japan’s attempt to exit deflation in 1997. This tax hike, the cornerstone of the fiscal strategy, therefore, was a calculated but courageous gamble—and has paid off. This should be considered as another major success of the government’s policy: The “second arrow,” a prudent fiscal policy, promotes confidence in long-term debt sustainability. 

The “third arrow,” structural reforms, remains the most important part of the equation—and has been the focus of most questions and skepticism since the launch of Abenomics. In this area, some important progress has already been made. On the financial side, the portfolio rebalancing of the Government Pension Investment Fund has begun spilling over to other institutions, such as Japan Post and the public employees’ pension funds. Probably more important are efforts to strengthen corporate governance through improving transparency and encouraging a more active role by shareholders and corporate boards. 

Japan’s productivity, after running at about 3% in the 1980s and about 2% in the 1990s, now languishes at a mere 1%. Weak corporate management practices and the ensuing inefficiencies are the main culprits for this productivity slowdown. Japan must boost nominal GDP growth on a durable basis to guarantee the sustainability of its massive debt burden. Besides a permanent rise in the inflation rate, this requires stronger overall real GDP growth. This must be achieved in the face of intensifying demographic pressures, as Japan’s population will continue to age rapidly in the coming decades. Government programs to boost the labor force, in particular by raising female participation, can help, but will not fully offset the impact of aging. To achieve stronger real GDP growth therefore, Japan must achieve faster productivity growth, importantly requiring a strengthening of corporate governance. Japan has therefore adopted a new corporate governance code, which formalizes explicit responsibilities for corporate boards to scrutinize management and communicate information to shareholders, and requires every board to have at least two external directors. Much more work will be needed to increase flexibility and boost productivity, but the measures already taken confirm that the government realizes that it must attempt to tackle the toughest reforms, even if this means clashing with powerful vested interests.

_____________________________________________
Clicking the Like button on various social media platforms, such as LinkedIn, Facebook, etc. does not constitute a testimonial for or endorsement of Redmount Capital Partners LLC or any Investment Advisor Representative. “Like” is not meant in the traditional sense. Posts must refrain from recommending investment advisory services or providing testimonials for our firm, since they are strictly prohibited. Please understand that we are required to delete such posts, since this is a regulatory requirement.

Monday, July 27, 2015

US Leading Indicator

RATE-OF-CHANGE TICKS UP, CONFIRMING MARCH 2015 LOW


The US Leading Indicator for June is up 5.5% from one year ago, with the 1/12 rate-of-change holding steady from its upward revised May value. Several successive months of strengthening building permits and a steepening yield curve have pushed the Index higher. The March 1/12 low confirms our expectation for a cyclical low for US Industrial Production in early 2016.


_____________________________________________
Clicking the Like button on various social media platforms, such as LinkedIn, Facebook, etc. does not constitute a testimonial for or endorsement of Redmount Capital Partners LLC or any Investment Advisor Representative. “Like” is not meant in the traditional sense. Posts must refrain from recommending investment advisory services or providing testimonials for our firm, since they are strictly prohibited. Please understand that we are required to delete such posts, since this is a regulatory requirement.

2Q2015 Market Observations


Below is a summary of what took place in the second quarter:

US Equities end flat for the quarter 

  • The S&P 500 returned (0.3%) for the quarter. Small cap outperformed mid and large cap. Mid cap was the weakest performing market cap segment with a negative return of -1.5%. 
  • The growth style outperformed the value style across the market cap spectrum. 
  • The health care and consumer discretionary sectors continue to outpace all other sectors. 
  • Utilities, energy, and industrials continue their negative streak with consumer staples joining the pack. 
  • Momentum and growth continue to be top performing factors while value and quality were weak performers. 
International and emerging market equities manager marginal gains 

  • MSCI EAFE returned 0.6% while MSCI EM returned 0.7% in the quarter. 
  • Small cap stocks outperformed in both international and emerging markets. 
  • In international developed markets, the Far East was the best performing region due to strong performance from Japan. The Pacific was the worst performing region due to Australia and weak commodity prices.
  • Emerging market performance was driven by the BRIC countries ex India. Brazil and Russia bounced off lows while China finished with strong gains despite a reversal late in the quarter.
  • Top and bottom performing sectors in international markets were telecom and financials at the top and health care and information technology at the bottom.
  • In emerging markets the top performing sectors were energy and health care with the bottom performing sectors being information technology and consumer discretionary. 
  • As in the US, momentum and growth were top performing factors in both developed and emerging markets. Beta and value were weaker factors in both developed and emerging markets. 
Global bonds sell off in the quarter 
  • Worries over rising US rates and a Greek default brought about volatility in bond markets. 
  • Long-dated Treasury bonds were the best performing segment of the bond markets as the yield curve steepened during the quarter. 
  • Short-term Treasuries and bank loans were the only positive performing segments during the quarter. 
  • Spreads widened for investment grade and high yield credit, negatively impacting returns. 
  • Non-US bonds posted negative returns except for dollar-denominated emerging market credit. Sovereign debt yields rose while currencies had a mix impact.
_____________________________________________
Clicking the Like button on various social media platforms, such as LinkedIn, Facebook, etc. does not constitute a testimonial for or endorsement of Redmount Capital Partners LLC or any Investment Advisor Representative. “Like” is not meant in the traditional sense. Posts must refrain from recommending investment advisory services or providing testimonials for our firm, since they are strictly prohibited. Please understand that we are required to delete such posts, since this is a regulatory requirement.

Wednesday, July 22, 2015

2Q 2015 Private Equity Environment

Market Overview
Global equity markets were rattled late in the second quarter with the prospect of a Greek debt default
and exit from Europe’s Economic and Monetary Union (EMU). On the second-to-last trading day of the quarter, following Greece’s decision to hold a referendum on the terms of a new debt bailout deal, the MSCI Europe index declined by 2.7%—its largest daily decline since October 2014. In the United States, the S&P 500 declined by more than 2%, which erased the index’s gains for the year. Asian
equity markets also sold off on the news, although most of the region’s equity indices finished the quarter with gains. Fixed income markets performed poorly overall in the second quarter. In particular, despite the commencement of the European Central Bank’s (ECB’s) quantitative easing program that drove much of the eurozone’s sovereign debt market into negative yield territory early in the quarter, euro-area government bonds experienced their largest-ever
quarterly loss, driven by concerns that yields had fallen too low in light of an improving economic outlook for the region.

Highlights

  • M&A exit transaction value for PE-backed companies totaled $174 billion in 1H15—a decline of 34.8% from the record-setting 1H14 total but still one of the largest first-half totals ever recorded.
  • High-yield default rates remain below historical averages in both the U.S. and Europe. However, sales of nonperforming loans reached a record high of €91 billion in 2014 and are expected to increase further in 2015.
  • PE firms worldwide raised $92.1 billion in 2Q15, a 9% increase over the prior quarter and a 17% increase over the year-ago quarter. The increase was driven by buyout- and U.S.-focused fundraising activity.


_____________________________________________
Clicking the Like button on various social media platforms, such as LinkedIn, Facebook, etc. does not constitute a testimonial for or endorsement of Redmount Capital Partners LLC or any Investment Advisor Representative. “Like” is not meant in the traditional sense. Posts must refrain from recommending investment advisory services or providing testimonials for our firm, since they are strictly prohibited. Please understand that we are required to delete such posts, since this is a regulatory requirement.

Wednesday, July 15, 2015

Investment strategy - Asset Management, 2nd quarter 2015

Deflationary pressures – and the associated risks to growth – are the common enemy faced by most economies across the globe.

At a glance
  • Deflationary pressures – and the associated risks to growth – are the common enemy faced by most economies across the globe. They are the motive behind the ongoing global easing cycle.
  • A stronger US dollar and the resulting foreign exchange market volatility argue for greater differentiation amongst portfolios, in accordance with their reference currency. Hedging has become a must.
  • Euro area investors will benefit from both liquidity injections and the materializing economic recovery – a positive outlook that supports our preference for risky assets over cash.
  • A more balanced approach is required when it comes to US dollar- and Non-US dollar- based portfolios, given the more limited equity market upside.
  • External debt levels and commodity intensity are dividing the emerging economies into two camps: those who can afford to loosen monetary policy (Asia) and those who are forced to keep rates high (Russia, Brazil).
_____________________________________________
Clicking the Like button on various social media platforms, such as LinkedIn, Facebook, etc. does not constitute a testimonial for or endorsement of Redmount Capital Partners LLC or any Investment Advisor Representative. “Like” is not meant in the traditional sense. Posts must refrain from recommending investment advisory services or providing testimonials for our firm, since they are strictly prohibited. Please understand that we are required to delete such posts, since this is a regulatory requirement.

Tuesday, July 7, 2015

6 Lessons from private equity any company can learn (especially before selling)

Too Faced Cosmetics in Irvine, CA was sold in November 2016 to Estee Lauder Companies for $1.45 billion, almost for $1 billion more than acquired one year earlier by the seller, General Atlantic. 

General Atlantic, a New York private equity firm, acquired the business in 2015 from another private equity firm, Weston Presidio. 

Too Faced was co-founded in 1998 by Southern California entrepreneurs Jarod Blandino and Jeremy Johnson.

The founders sold Too Faced to Weston Presidio in 2012, for only $71 million.

How did Too Faced Cosmetics' value go from $71 million to $1.45 billion during the 2012 to 2016 period? 

There may be several explanations, but the key answer is in the way how private equity owned businesses are owned, managed, perform, and grow in value. 

Can we identify key factors why private equity owned businesses seemingly do better, at least for short- and intermediate-term, than their industry peers?

Consulting giants, led by Bain & Company, a successful private equity investor in its own right, offer a list of lessons any company can learn from private equity.

1. Define the full potential. The target is to increase equity value - how to turn $1 of equity value today into $3, $4, or $5 tomorrow.

2, Develop the blueprint. The blueprint is the road map for reaching your full potential - the who, what, when, and how.

3. Accelerate performance. This involves molding the organization to the blueprint, matching talent to key initiatives, and getting people to own them. 

4. Harness the talent. This requires creating the right incentives to recruit, retain, and motivate your best talent - and get them to think and act like owners. 

5. Make equity sweat. This calls for managing working capital aggressively, disciplining capital expenditures, and working the balance sheet hard.

6. Foster result-oriented mind-set. The goal is inculcate disciplines so that they become part of the company's culture and create a repeatable formula for achieving results.

Are the above 6 keys the reason why private equity owned businesses perform better than their peers over short and intermediate term intervals?

Private equity firms impose certain disciplines and models to force companies to succeed or at least satisfy their highly driven and monetary-oriented ownership. Companies are forced to immediately improve financial efficiency, performance, and continuity.

Well-placed partners of private equity firms serve as company ambassadors, acting as connectors to valuable contacts and strategic opportunities.


A study by A.T. Kearney (leading global consultancy) revealed the following:
  1. Private equity owned companies generally outperform their industry peers, primarily in slow-growth industries, such as chemicals, large consumer goods and retail, manufacturing and business services.
  2. Contrary to popular belief, PE firms that take on a supervisory role—giving the deal partner
    responsibility from acquisition through exit— deliver more value by balancing growth and profitability.
  3. Success factors of PE firm models are transferable for those willing to learn.

Why private equity firms love cash?
PE players look at their balance sheet not as static indicators of performance, but as dynamic tools for growth. One critical component of this approach is to aggressively manage down working capital.


___________
"We love to discover companies with hidden gems like owned real estate which we can later sell and lease back, extracting our equity and reducing our base investment costs. It happens often and sellers could easily take advantage of these if they only reviewed their assets before selling to us."  Mid-size private equity executive.


_____________________________________________
Clicking the Like button on various social media platforms, such as LinkedIn, Facebook, etc. does not constitute a testimonial for or endorsement of Redmount Capital Partners LLC or any Investment Advisor Representative. “Like” is not meant in the traditional sense. Posts must refrain from recommending investment advisory services or providing testimonials for our firm, since they are strictly prohibited. Please understand that we are required to delete such posts, since this is a regulatory requirement.


Wednesday, July 1, 2015

Long U.S. election campaigns

It is well known that the periods of U.S. presidential elections add to economic uncertainties, market volatilities, and consumer inconfidence.

What also transpires, more and more, longer cycles of elections.

This chart shows the days before elections, when presidential candidates announced their intent to run for the president's office. 2016 looks to be a relatively shorter election cycle.


_____________________________________________
Clicking the Like button on various social media platforms, such as LinkedIn, Facebook, etc. does not constitute a testimonial for or endorsement of Redmount Capital Partners LLC or any Investment Advisor Representative. “Like” is not meant in the traditional sense. Posts must refrain from recommending investment advisory services or providing testimonials for our firm, since they are strictly prohibited. Please understand that we are required to delete such posts, since this is a regulatory requirement.

Saturday, June 20, 2015

Sale-Leaseback, A Hidden Treasure Chest?

American companies, including smaller, family-owned businesses and Corporate America, own an estimated $4.1 trillion of non-specialized "investable" real estate. Yet historical returns from equity investments have consistently exceeded those of real estate. As a general rule, any dollar that can be "monetized" or sourced from the sale of corporate real estate and reinvested in that company's listed or unlisted equity stock would create positive leverage.

That's why any business owner or CFO whose company owns real estate should review or consider a sale-leaseback transaction.

What is Sale-Leaseback?
Although used for more than 50 years, sale-leaseback transactions – and the benefits they can offer to corporate investors – are still not always fully understood.

In it simplest form, a sale-leaseback transaction entails the sale of corporate real estate and the simultaneous commitment to a long-term lease, generally 15 years or longer. This combination allows a company to redeploy the capital that had been invested in real estate into the core business.

Why is it worthwhile?
The biggest benefit of a sale-leaseback transaction is the ability to increase a company's financial flexibility by off-loading real estate at attractive long-term rates, while maintaining the availability of bank financing for a future date. By being both the lessee and the seller of the property, a corporation has greater bargaining power to ensure it maintains uninterrupted control of the facilities, including operations, maintenance and alterations, it negotiates the rights to assign and sublet the facilities, as well as enjoys lengthy initial and renewal terms.

What's the catch?
While sale-leaseback can be a worthwhile strategy for many companies, it is not without risk. Some of the risks to consider are:

Loss of residual property value
In most cases, the future value of any single-tenant property will be lower than today's sale price since real property generally depreciates over time. In the unlikely event that the residual value of the property increases over the primary lease term, the potential rental income from the property will increase as well. By negotiating a renewal option past the primary term at fixed rents, the seller/lessee can enjoy rental costs that are below market while still benefiting from greater potential sublease income.

Possible Relocation
At the end of a lease without any renewal options, a seller may be forced to either negotiate an extension at current market rents or relocate. To prevent such a situation in a sale-leaseback transaction, a company should consider employing a long-term (50-60 years) lease, thereby delaying the need to relocate or renegotiate until the asset will likely have become obsolete. When the term comes due, the buyer/lessor almost always would allow renewal of the lease, and on a worst case basis, at the same price the seller/lessee would pay for alternative space.

High Rental Payment
Rental payments under the lease cannot be adjusted without the consent of the lessor. As a result, if the rental market softens, a seller/lessee may be locked into a rate higher than the market rate. Yet, the company has protected itself from a decrease in property value and still enjoys the use of the capital. In addition, a decrease in rental rates represents a good opportunity to renegotiate the lease at a lower, modified rental rate for a new primary term.

Specific Accounting Principles
While the fundamental accounting principles of sale-leasebacks are relatively simple, following the generally accepted accounting principles (GAAP) provisions are critical. Failure to comply may result in the re-characterization of a sale-leaseback transaction as a mere financing vehicle, depriving the parties of the very benefits they have sought to achieve.

Can Sale-Leaseback Add Financial Value?

Will it strengthen company financials or enhance shareholder wealth? Can sale-leaseback pay down debt, reduce risks, increase working capital, or fund acquisitions by executing sale-leaseback?

Basic diagnosis can show financial impact analysis, blended cost of capital and other potential transaction terms/conditions, analysis of impacted balance sheet, efficiency, liquidity, & risk ratios,

To take further steps and diagnose your own opportunity click here

_____________________________________________
Clicking the Like button on various social media platforms, such as LinkedIn, Facebook, etc. does not constitute a testimonial for or endorsement of Redmount Capital Partners LLC or any Investment Advisor Representative. “Like” is not meant in the traditional sense. Posts must refrain from recommending investment advisory services or providing testimonials for our firm, since they are strictly prohibited. Please understand that we are required to delete such posts, since this is a regulatory requirement.